
Skip to content
Resources / Release notes

What's new in FutPrint.
Every release, dated.

The complete record of what has shipped to the FutPrint web terminal and desktop apps: new modules, indicator engines, option analytics, fixes and performance work for traders on NSE, BSE and MCX.

Latest 26.11.1 · RSS feedDesktop apps
50Releases since November 2025
462Documented changes
26.11.1Current version
Web · Mac · WindowsPlatforms covered
50 releases

November 2026

26.11.1Major release

Ask FutPrint works the chart for you, plus a Market Calendar, Sector Rotation and a daily Market Mood score

Tell Ask FutPrint what to do on a chart in plain words and it adds indicators and drawings, changes the view, timeframe or symbol, sets alerts, marks candles by volume or size and, on Pro and Max, finds order flow, with every change on a card you can undo. The terminal also gains a Market Calendar, a Sector Rotation chart, Smart Money and Delivery views in Institutional Flow, a daily Market Mood score and a Market Events study that marks expiries and results on the chart, all on every plan.

New

  • Ask FutPrint works the chart. The Ask drawer still answers how-do-I questions from the guides, and now also does what you ask on a chart, in plain words in English or Hinglish: "add a 20 EMA", "draw a line at yesterday's high", "switch to 15m", "go to 15 Oct", "remove the RSI". It adds, changes, hides and removes indicators, including a saved script by its name; draws and edits lines, rectangles, channels, Fibonacci levels, position boxes, anchored VWAP, text and the other drawing tools at the dates and levels you name; zooms, pans, fits the view and goes to a date; changes the timeframe, symbol, chart type, session and chart settings; and starts a replay at the time you name, then plays, pauses, steps or exits it. Indicators, chart types and timeframes follow your plan as they do in the menus. Acts on, above the question box, names the chart it works on: it follows the active chart, or you pick one from its list when several are open. The empty drawer offers Do it on the chart starters such as Add a 20 EMA and Switch to 15m. Each request counts as one question in the same allowance as before, 40 quick answers a day and then one a minute up to 300, on every plan. Ask FutPrint in the workspaces guide.
  • Every change on a card, with Undo. Each action appears in the answer as a card saying what it did, and Undo in the card's header reverses everything that answer changed, newest first. Before it removes every indicator or drawing, makes several removals in one step, deletes an alert, or changes the name or message of an alert that posts to a webhook, Telegram or email, the card asks first, and nothing in that step runs until you confirm. Locked drawings are never removed. A request is worked through in up to three rounds, with at most ten actions in one step; for a longer job, ask again.
  • Alerts from the drawer. Ask FutPrint creates, edits, pauses, resumes and deletes your alerts: "alert me when price crosses 26,000", "alert at yesterday's low", "turn the line at 25,800 into an alert", or a rule of up to five conditions such as "alert when RSI crosses above 70 on 5m". They are the same alerts as in the Alert Manager and on the chart, under the same plan limit. Price levels, horizontal lines and the indicator conditions that alerts support can be alerted; trend lines and other sloped drawings cannot. Alerts guide.
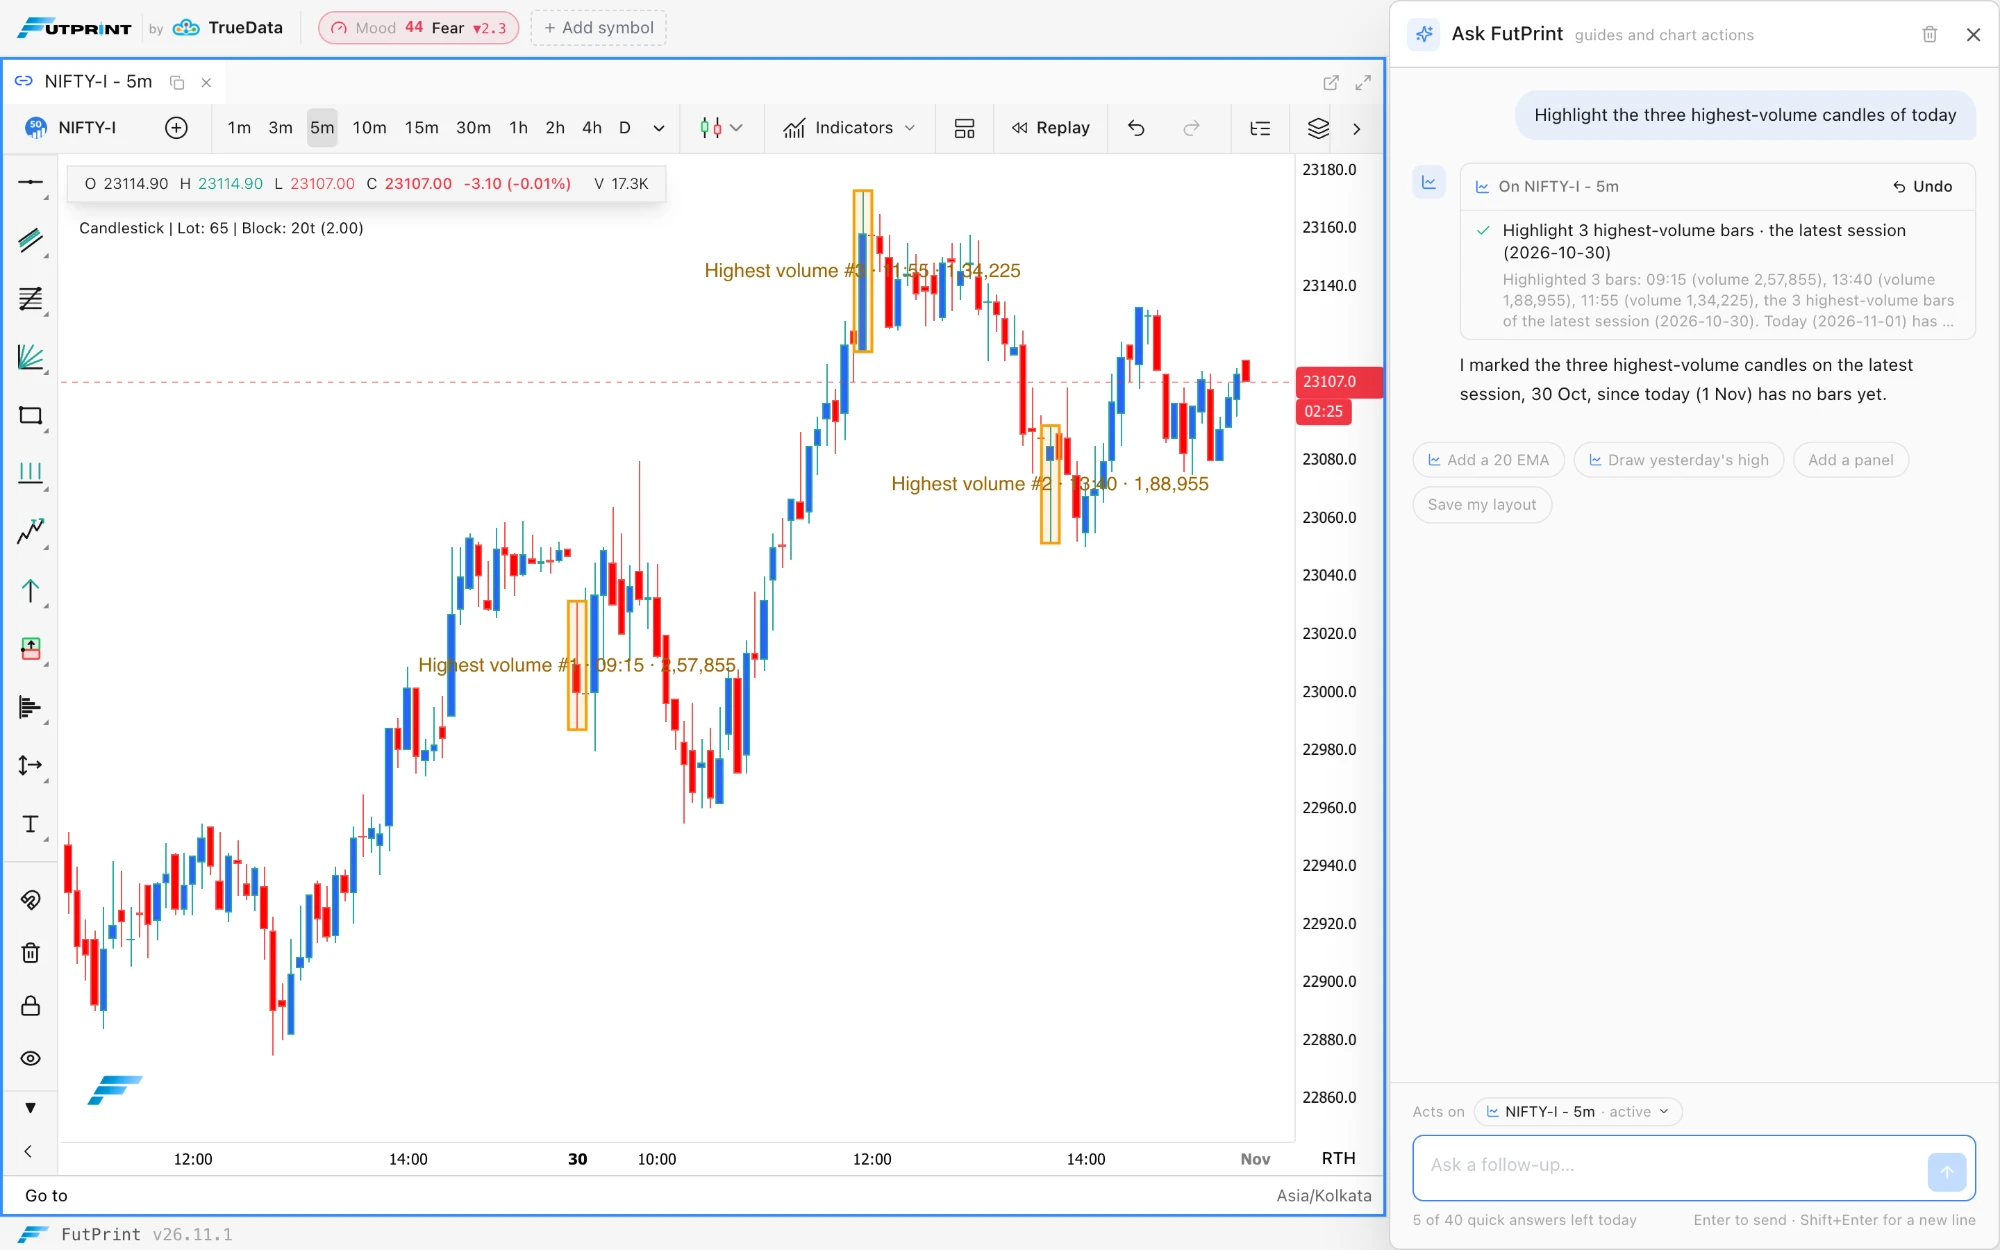
  • Mark candles by volume or size. Ask for "the lowest-volume candle today", "the three widest-range bars yesterday" or "the biggest down candle on screen" and each candle is boxed, or marked with a line or a label, with its time and value. The picks are lowest or highest volume, widest or narrowest range, biggest or smallest body, highest high, lowest low and biggest up or down candle, up to five at a time, over a day, the bars on screen, everything loaded or a window. They read the bars loaded on the chart, so for an earlier day the assistant goes to that day first, and the candle still forming is left out of volume and size picks. A pick can also anchor a drawing: "draw a line at the high of yesterday's highest-volume candle".
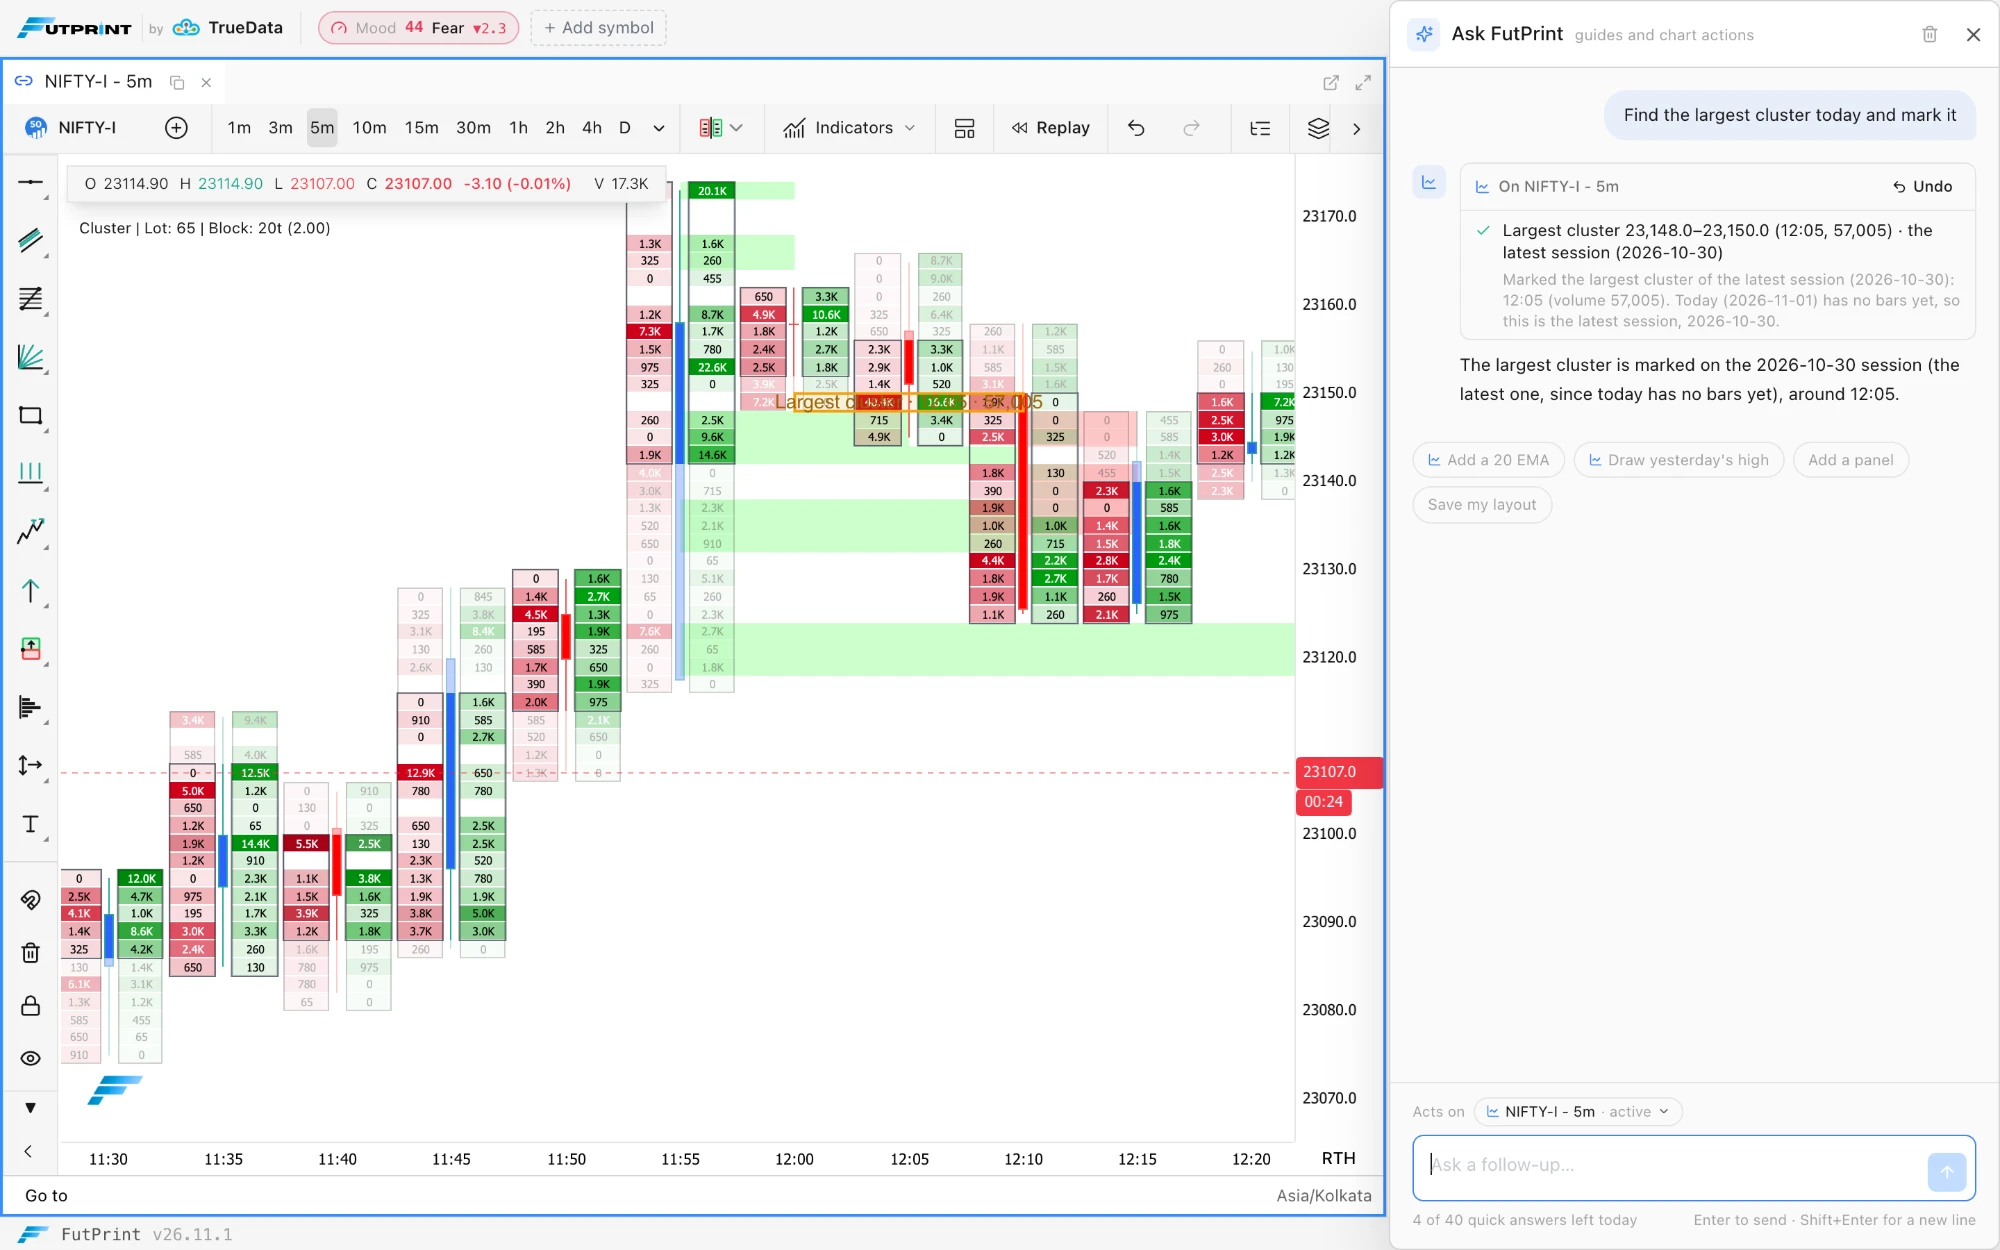
  • Order-flow finds on Pro and Max. Ask for the largest cluster, the POC, the biggest delta bar, the largest Big Trades print or stacked buy or sell imbalances over a day, the bars on screen or a window, and the browser finds them in the chart's own footprint data, marks each one and shows its price and volume on the card. Rows are grouped as the footprint draws them, so a find matches the cells on screen, and footprint data missing for the loaded bars is fetched first. The largest print needs the Big Trades indicator on the chart, and the assistant says so when it is missing. An index has no traded volume of its own, so ask on its future instead. Big Trades guide.
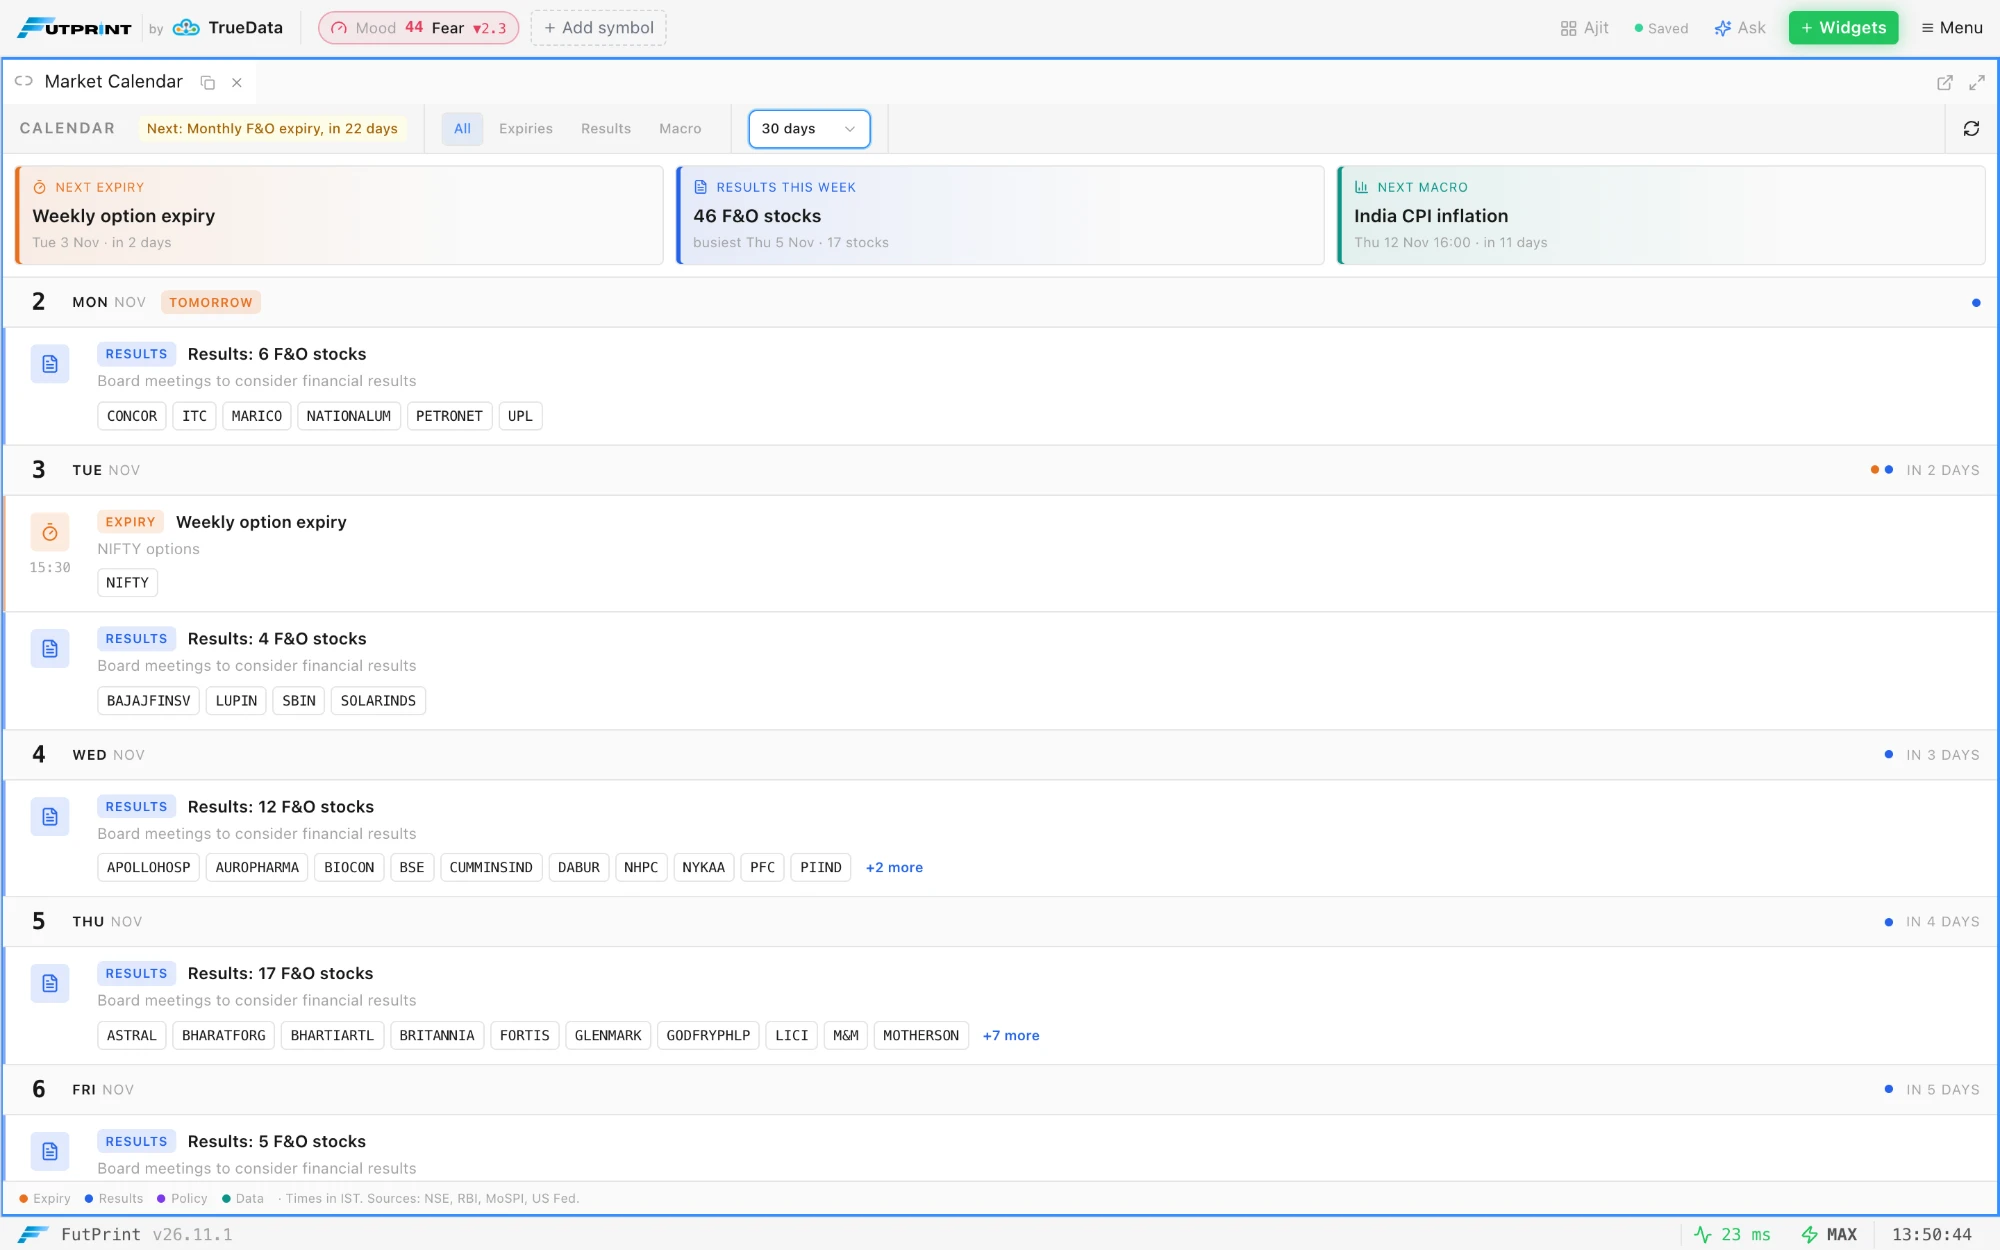
  • Market Calendar, under Widgets ▸ Market Overview, lists the days ahead with index F&O expiries, results days for F&O stocks, RBI and FOMC decisions and CPI, GDP and IIP releases, each kind in its own colour. The Next expiry, Results this week and Next macro cards filter the list when clicked, as do the All, Expiries, Results and Macro pills, and the window is 14 days, 30 days or 60 days. High-impact events carry a ★ Key tag, and today and tomorrow are flagged on their day headings. On every plan.
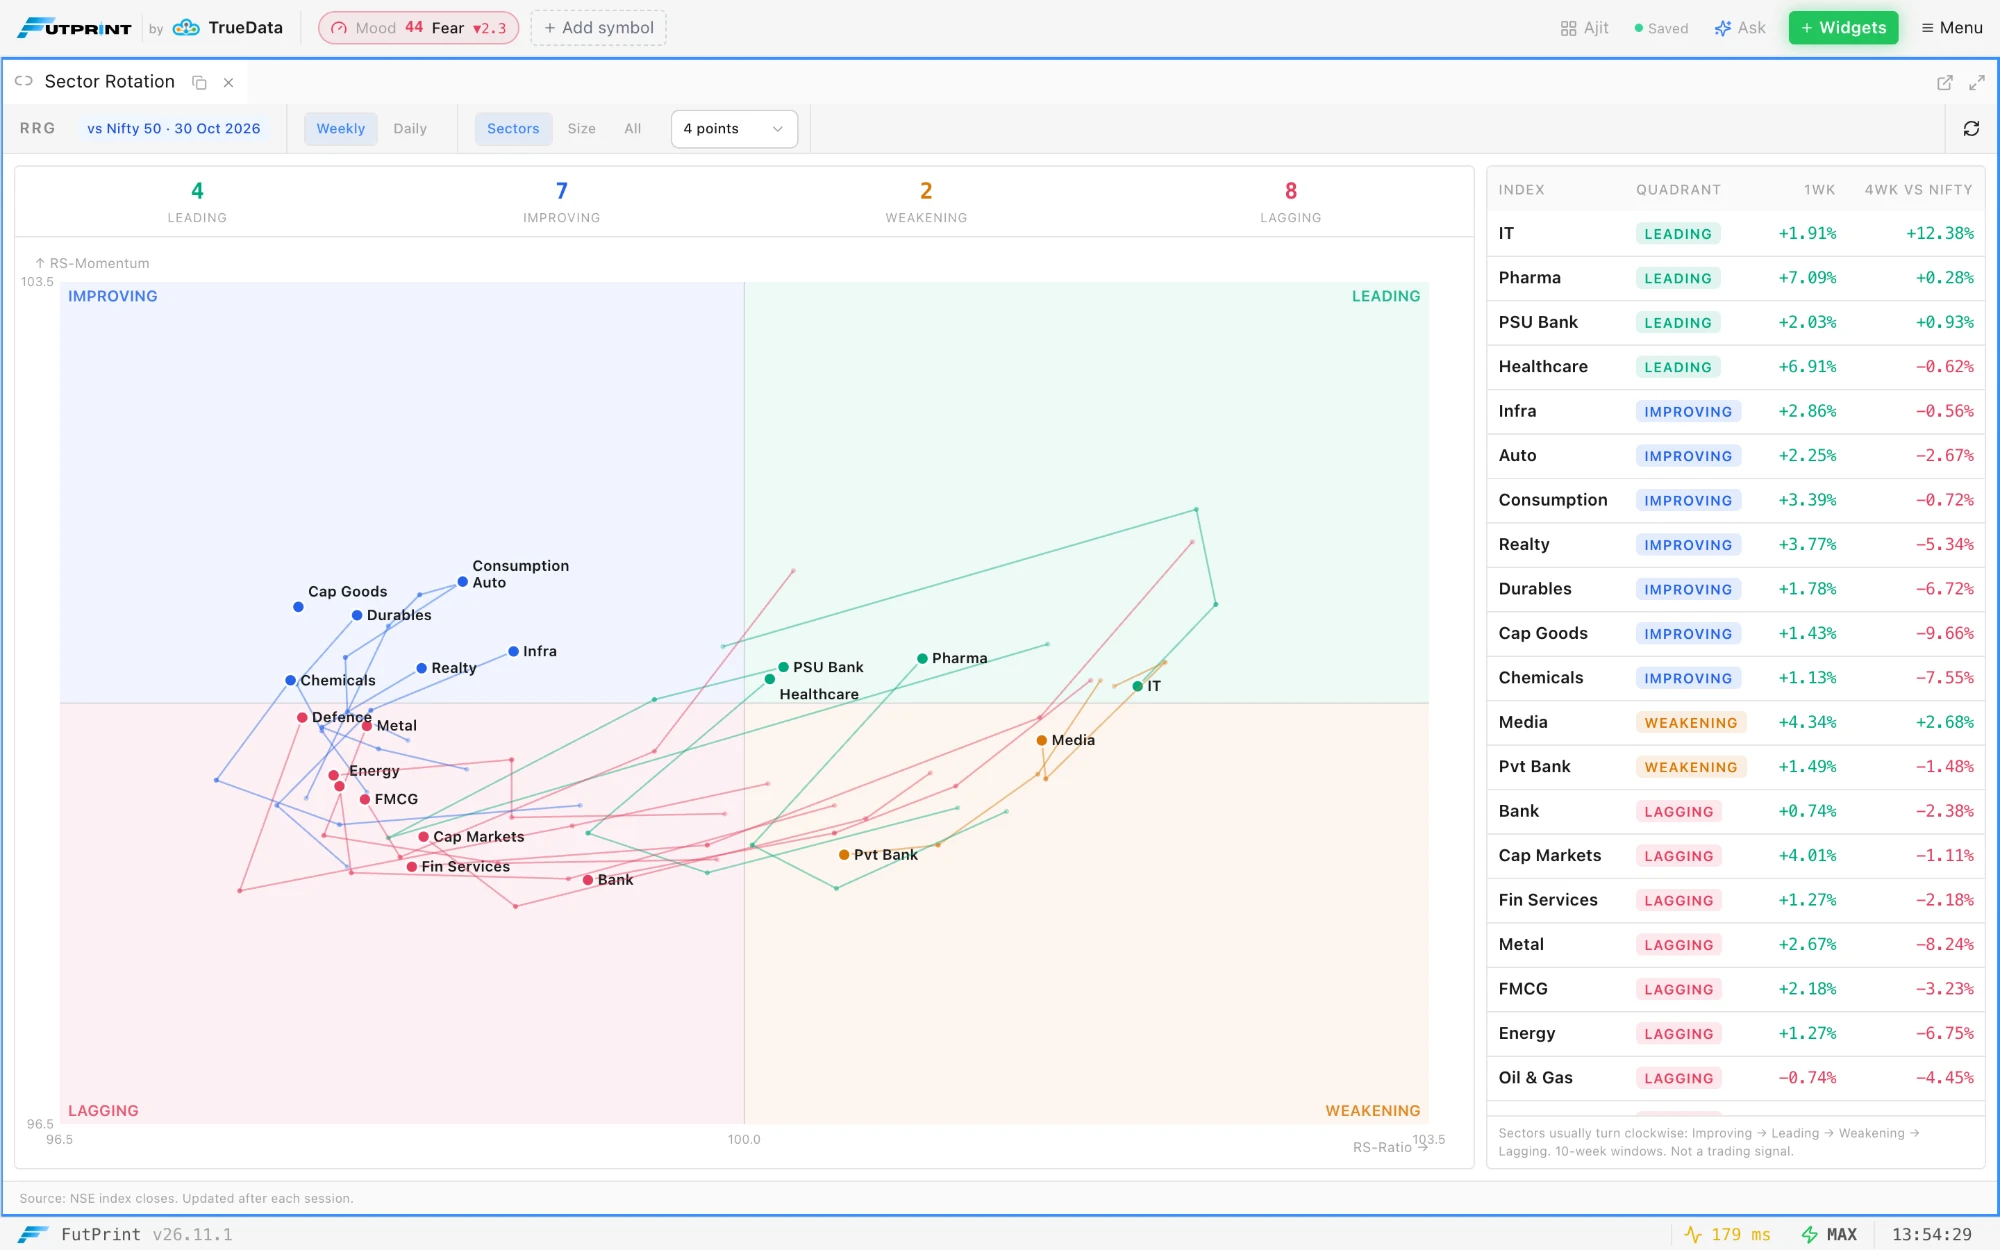
  • Sector Rotation, under Widgets ▸ Market Overview, plots 21 NSE sector indices, plus the Midcap 100 and Smallcap 100, against the Nifty 50 on a relative rotation chart, RS-Ratio across and RS-Momentum up, in Leading, Weakening, Lagging and Improving quadrants with a count in each. Each index carries a fading trail of 4 points, 8 points or 12 points on Weekly or Daily closes, and the table beside the chart ranks the indices with their quadrant, last return and four-period return against the Nifty; hover a row to pick that index out on the chart. Sectors, Size and All choose which indices show. End of day, on every plan.
  • Market Mood is a daily 0–100 fear-and-greed score built from six end-of-day signals: momentum, volatility, breadth, the put-call ratio, FII flow and FII positioning. It sits in the header beside the logo with its band (Extreme fear, Fear, Neutral, Greed or Extreme greed); click it for each signal's reading and the score's history. The same score heads the Market Pulse panel as a strip with the change from the previous session, a band gauge, a bar per signal and a 1M, 3M or 6M history chart over the fear and greed bands, with each session's reading on hover. It is an end-of-day score and changes once a session.
  • Market Events study, under Indicators ▸ Profile & Market Structure, marks the Market Calendar on the chart as dashed lines with coloured flags: EXP, RES, RBI, FED, CPI, GDP and IIP. An index chart shows its own expiries, a stock chart the monthly expiry and that stock's results, and every chart the policy and macro dates. Upcoming events are flagged past the last candle, by trading day on daily charts and on the bar of their release time on intraday charts, which also list the next three in an UPCOMING box. Past events are marked back to 180 days. Each kind can be switched off in the study's settings, beside a Minimum importance filter.
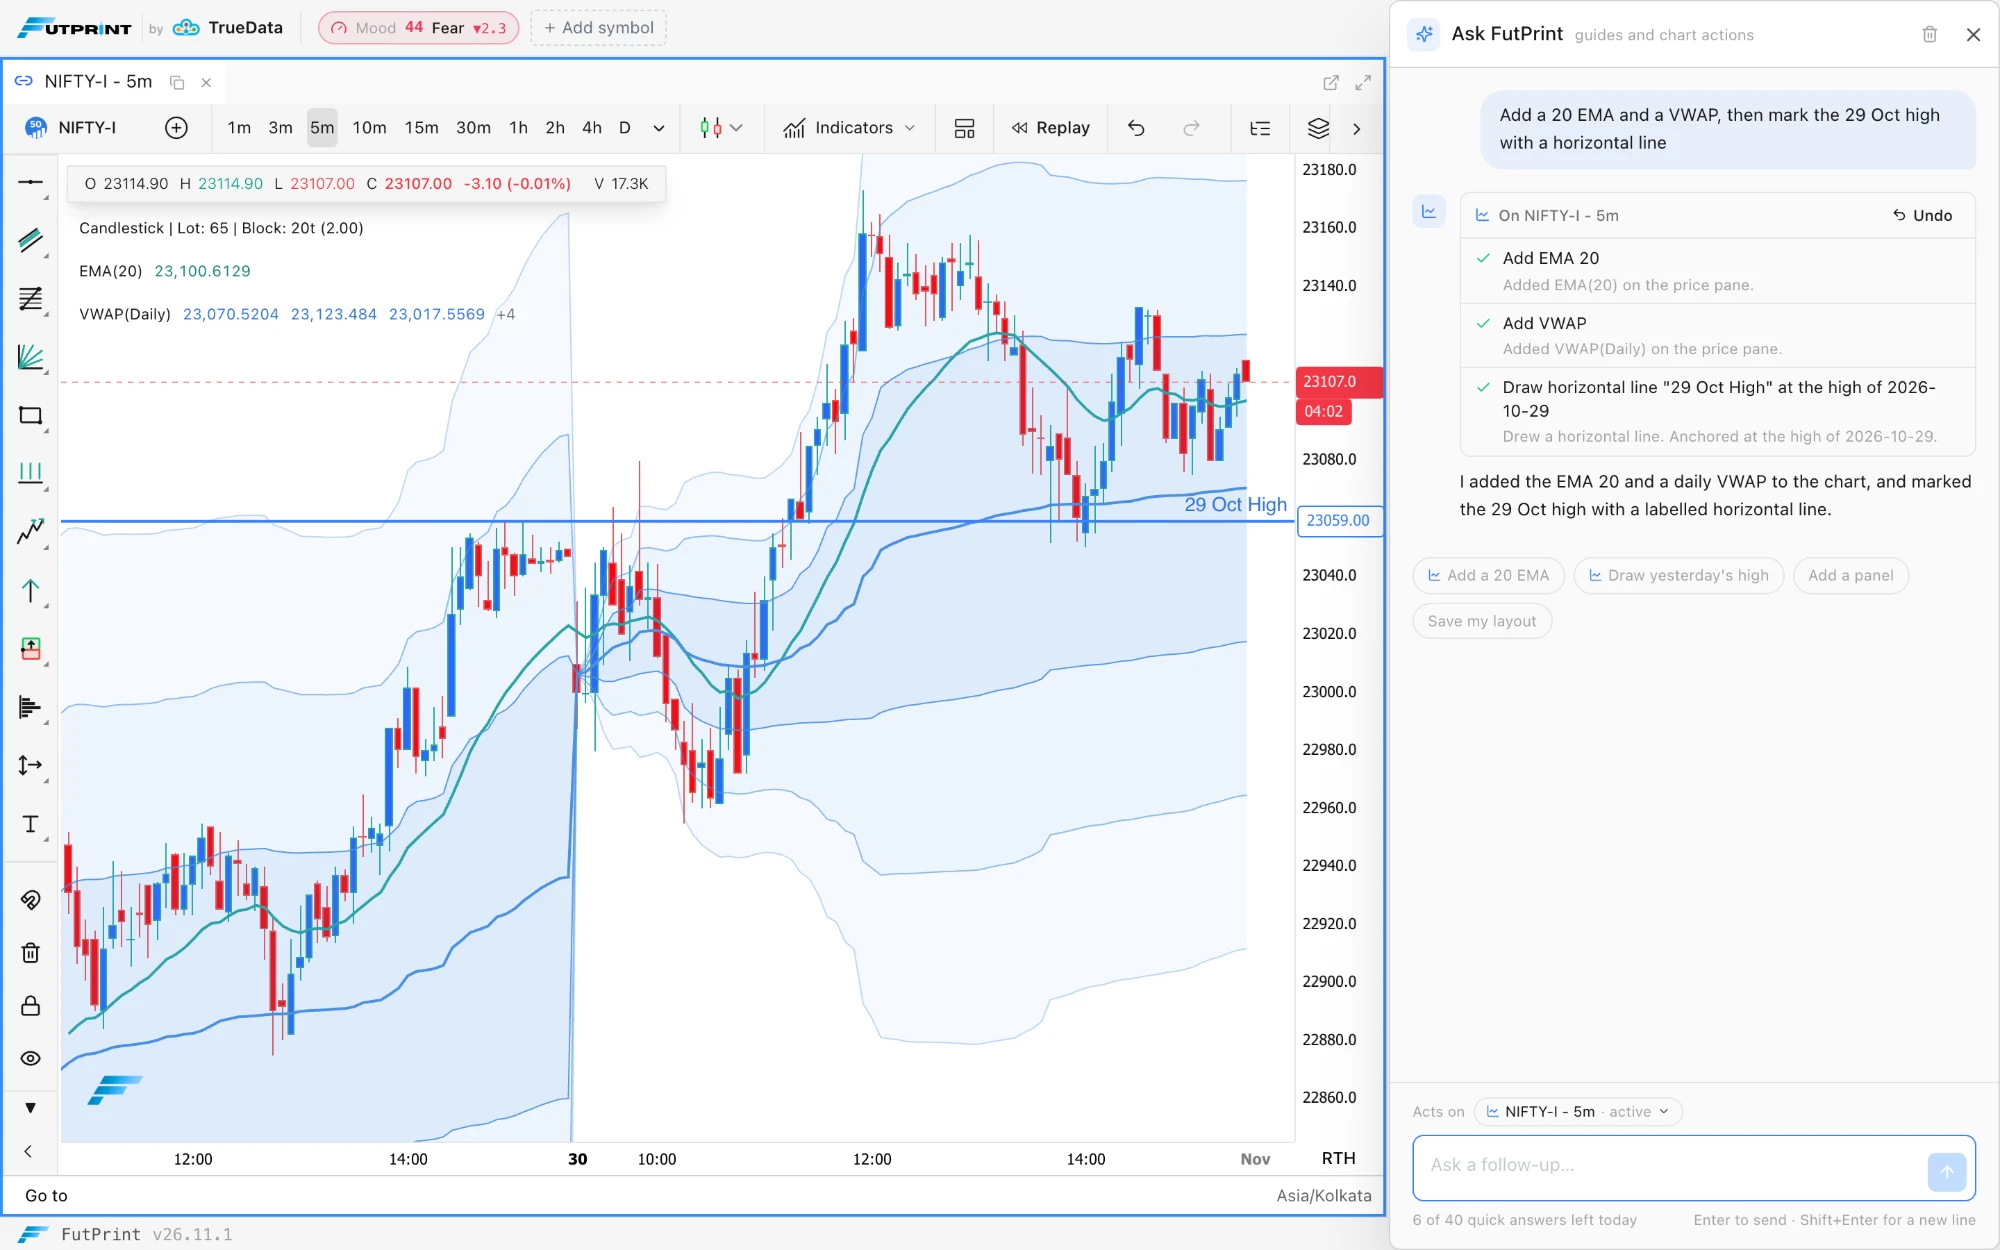
A NIFTY futures 5-minute chart in the light theme with the Ask FutPrint drawer open on the right: the question "Add a 20 EMA and a VWAP, then mark the 29 Oct high with a horizontal line", a run card headed On NIFTY-I - 5m with Undo and three ticked steps, Add EMA 20, Add VWAP and Draw horizontal line "29 Oct High" at the high of 2026-10-29, and on the chart the EMA, the VWAP with its bands and the labelled line.
Say what to do on the chart: each action shows as a card, and Undo reverses the lot.
The same chart after "Highlight the three highest-volume candles of today": three orange boxes on the 30 October candles at 09:15, 13:40 and 11:55, each labelled with its rank, time and volume, and the card listing the three bars with their volumes.
Candles picked by volume or size are boxed, with their times and volumes on the card.
A NIFTY futures 5-minute cluster chart with the Ask drawer: after "Find the largest cluster today and mark it", the card reads Largest cluster 23,148.0–23,150.0 (12:05, 57,005) and an amber box labelled Largest cluster · 12:05 · 57,005 marks the cell on the 12:05 bar.
On Pro and Max, order-flow finds are read from the chart's own footprint data.
The Market Calendar panel maximised on All and 30 days: cards for the next expiry (Weekly option expiry, Tue 3 Nov, in 2 days), results this week (46 F&O stocks, busiest Thu 5 Nov) and the next macro event (India CPI inflation, Thu 12 Nov 16:00), above day rows from Mon 2 Nov with expiries in orange, results in blue, policy in violet and data releases in teal.
The Market Calendar: expiries, results and policy and macro dates, each in its own colour.
The Sector Rotation panel maximised, RRG vs Nifty 50 for 30 Oct 2026 on weekly closes: sector indices with four-point trails in the Leading, Improving, Weakening and Lagging quadrants, counts of 4, 7, 2 and 8, and the ranked table with IT leading at +1.91% for the week and +12.38% over four weeks.
Sector Rotation against the Nifty 50, with a trail per index and the ranked table.
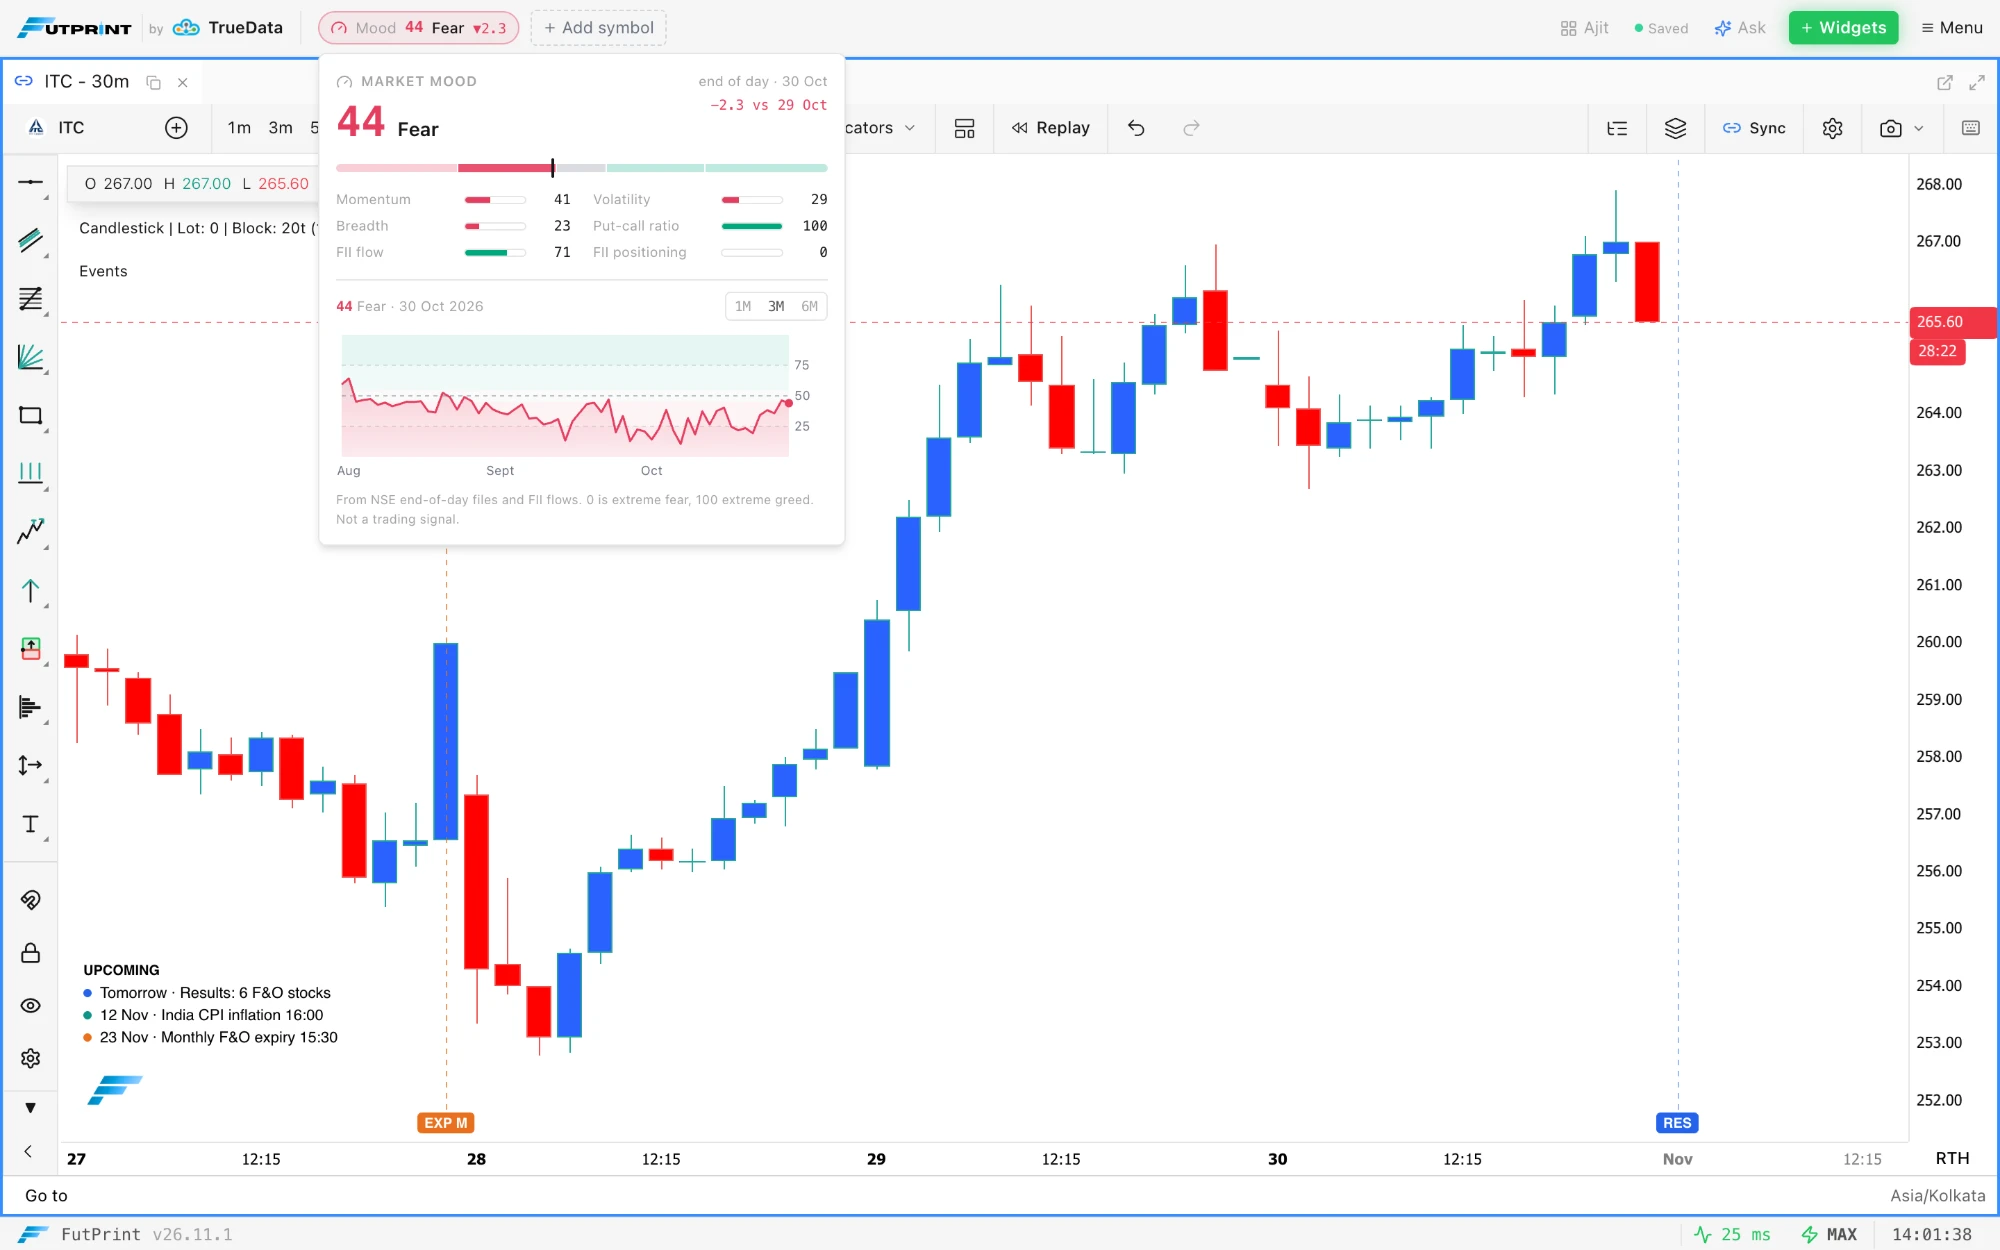
The Market Mood pill in the header reading Mood 44 Fear, down 2.3, with its popover open over an ITC 30-minute chart: the end-of-day gauge for 30 Oct, six signal bars (Momentum 41, Volatility 29, Breadth 23, Put-call ratio 100, FII flow 71, FII positioning 0) and the history chart over the fear and greed bands.
Market Mood in the header: the end-of-day score, its six signals and its history.
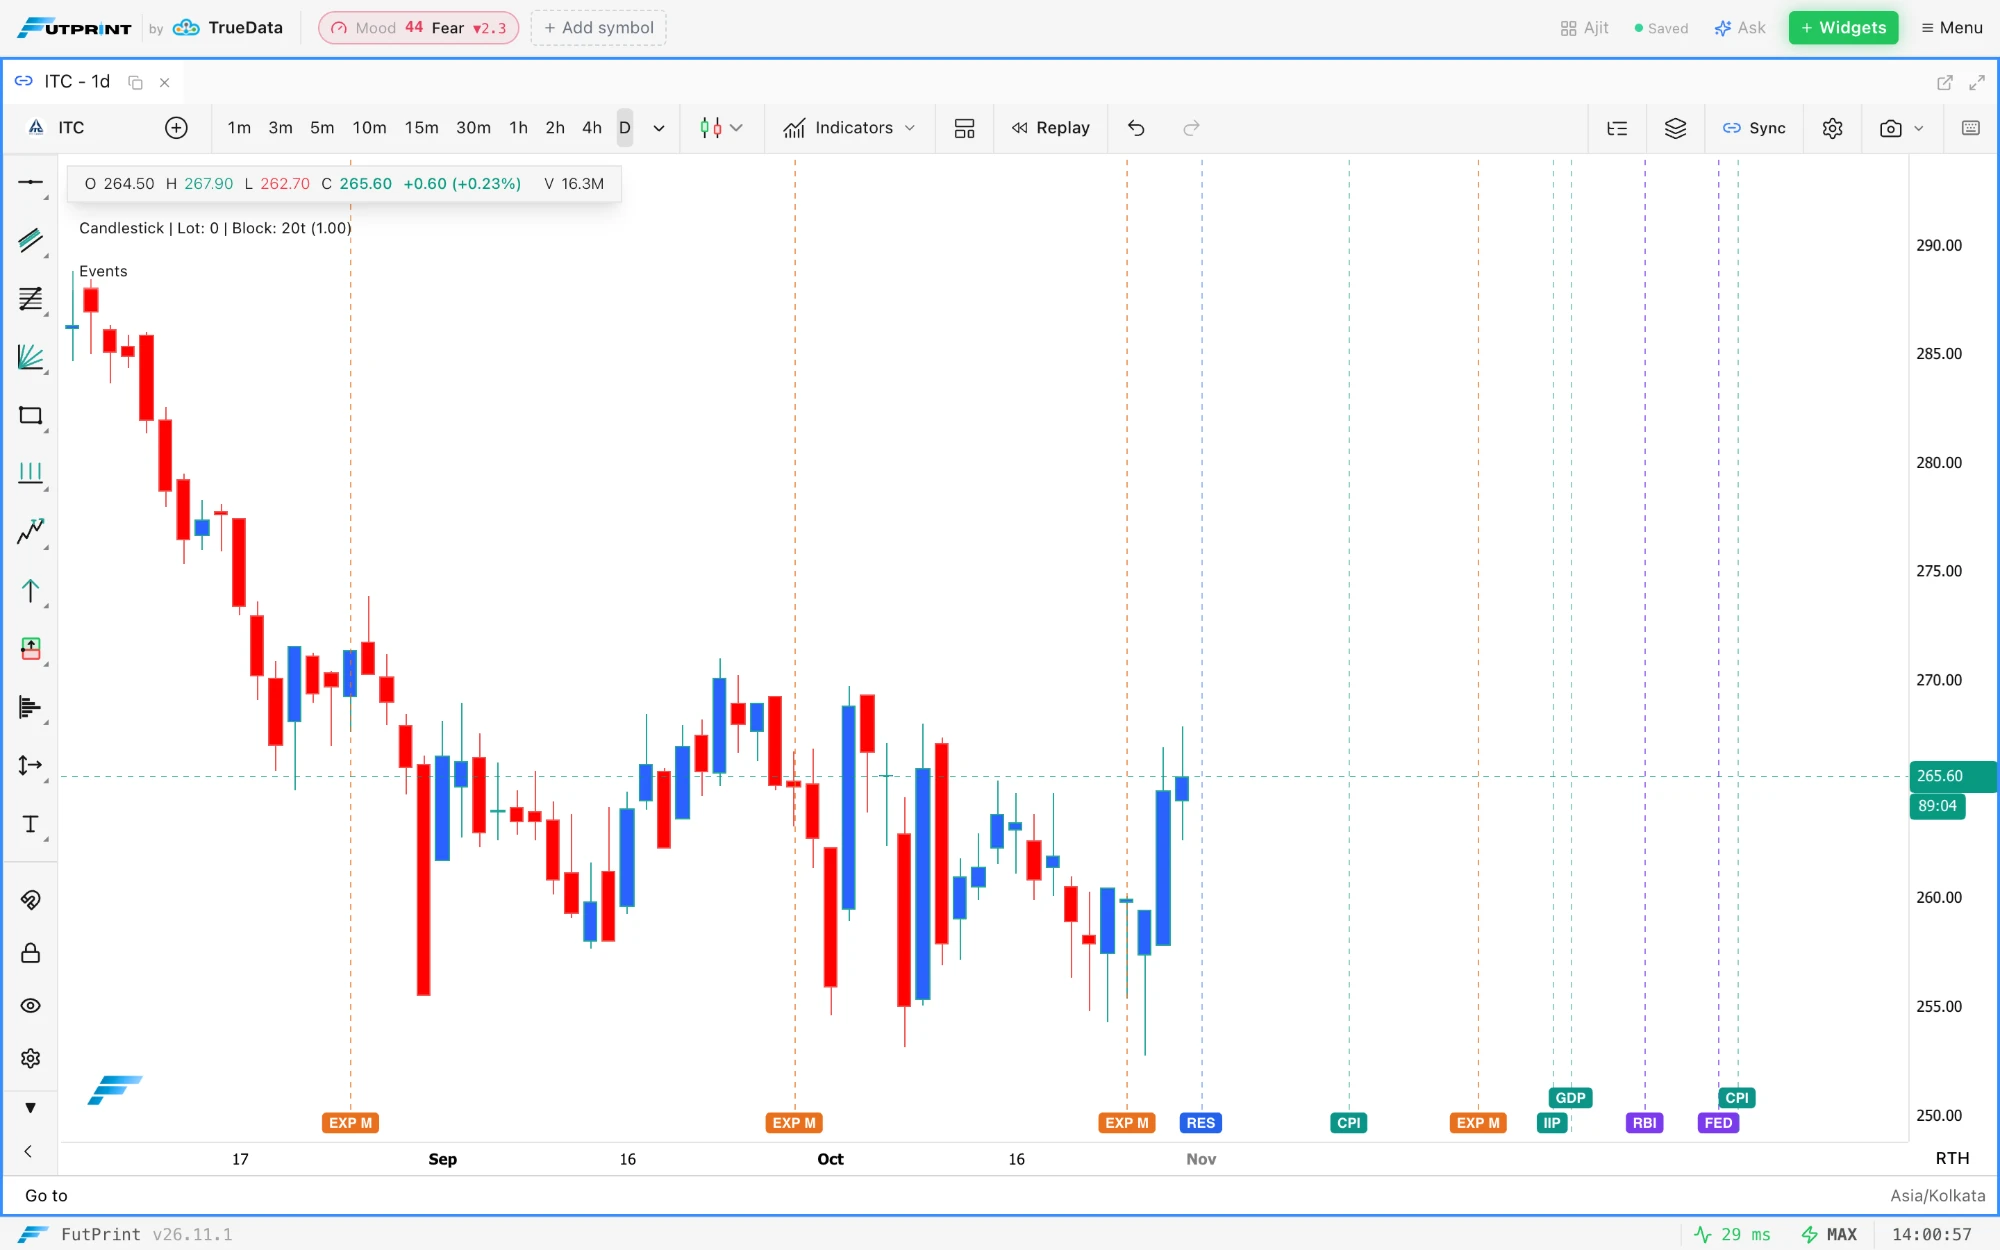
An ITC daily chart with the Market Events study: dashed lines with EXP M and RES flags on past sessions, and CPI, EXP M, IIP, GDP, RBI, FED and CPI flags projected to the right of the last candle.
Market Events on a daily chart, with upcoming dates projected past the last candle.
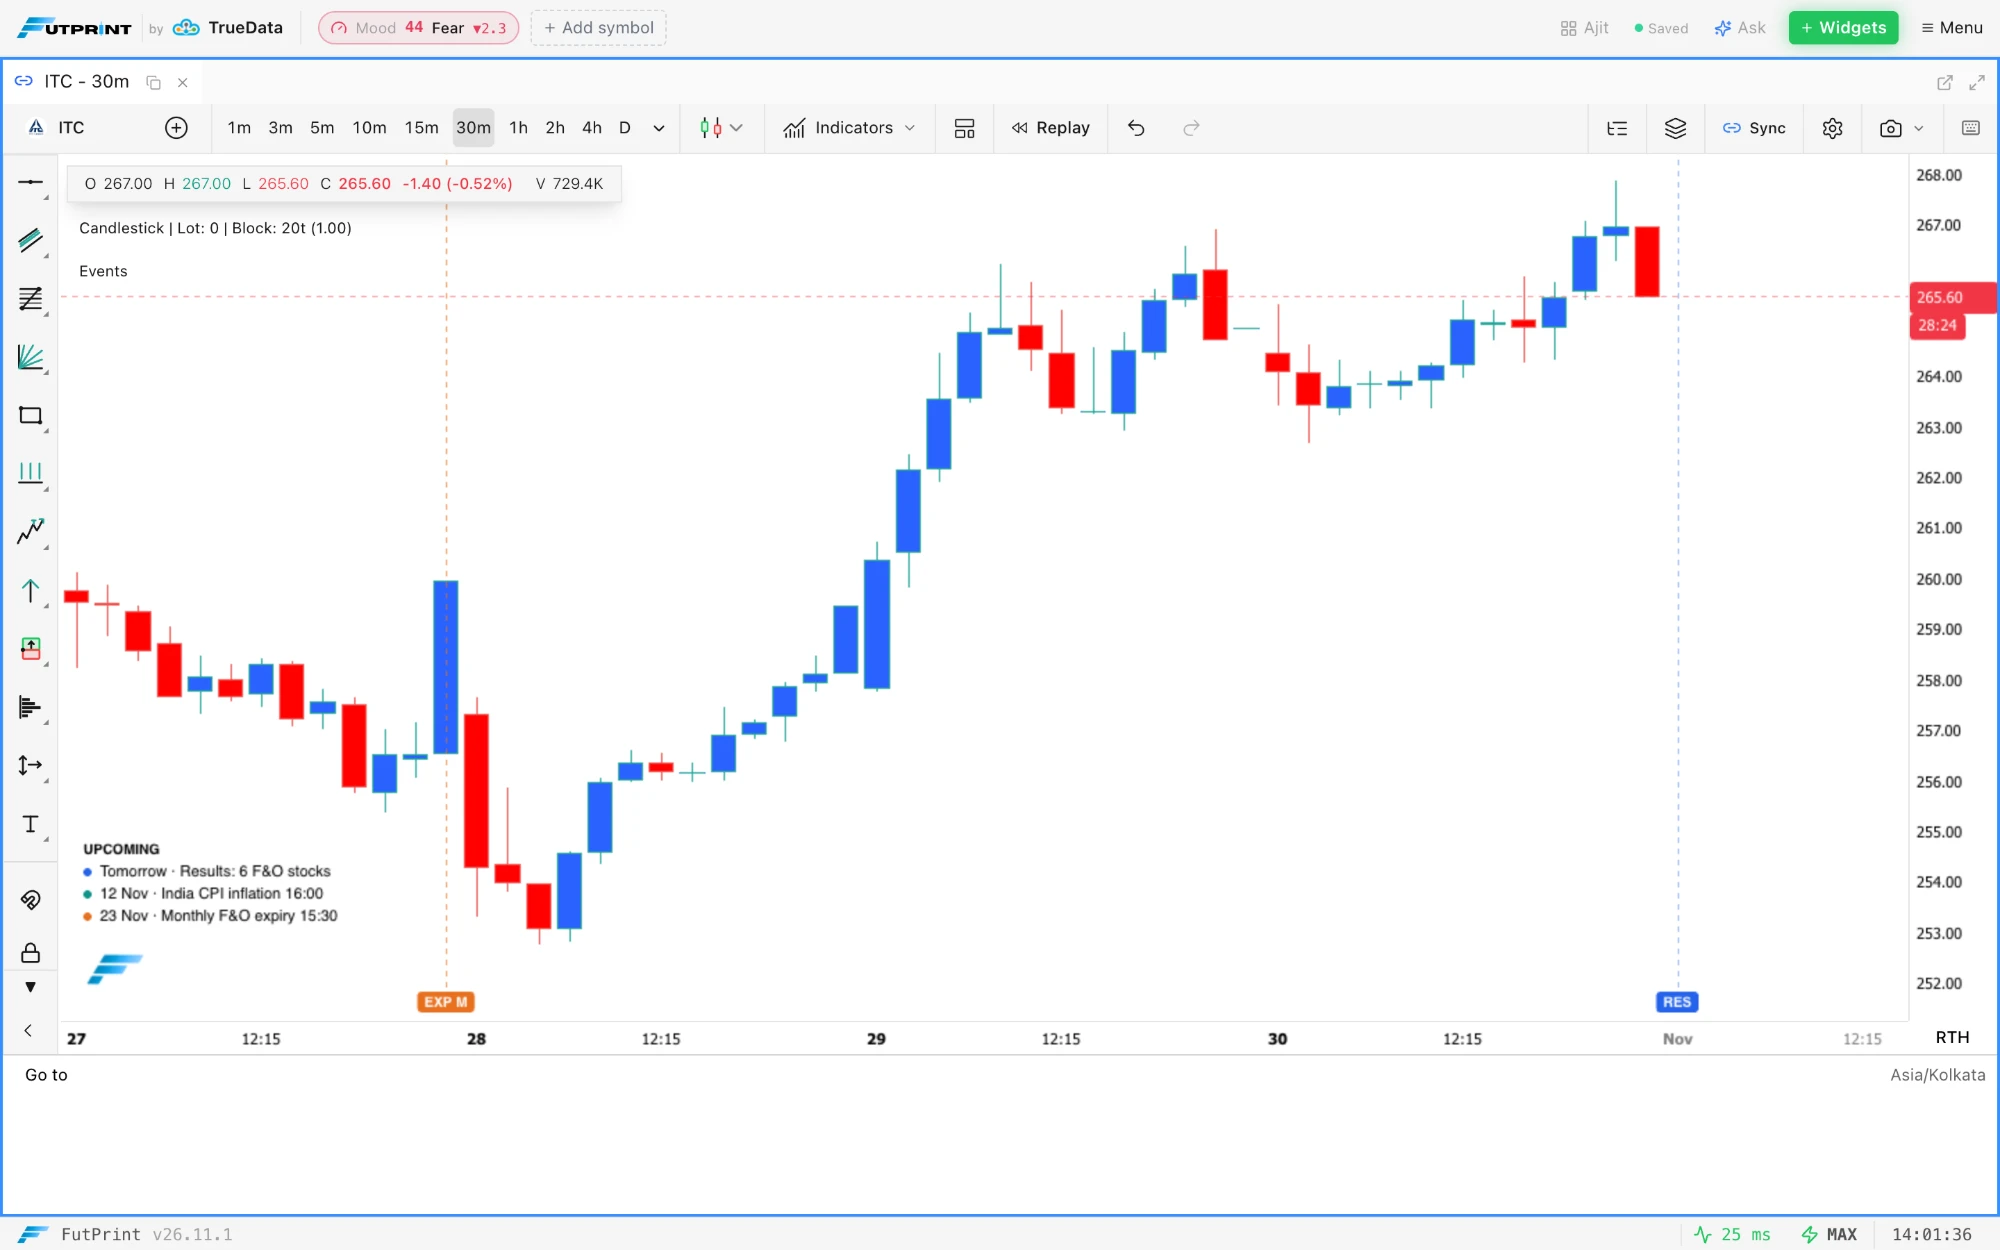
An ITC 30-minute chart from 27 Oct to 2 Nov with EXP M and RES flags on their bars, and the UPCOMING box listing Tomorrow · Results: 6 F&O stocks, 12 Nov · India CPI inflation 16:00 and 23 Nov · Monthly F&O expiry 15:30.
On intraday charts upcoming events are flagged on their bars and listed in the UPCOMING box.

Improved

  • Smart Money view in Institutional Flow. A third view beside Flows and Positioning lists NSE bulk and block deals, insider trades disclosed under SEBI PIT and SAST Regulation 29 filings, with All, Bulk, Block, Insider and SAST pills, a minimum value from Any value to ≥ ₹50 cr, and a search by symbol, company or party. Cards above the table give the Bulk + block net, the Insider net, the Largest net symbol and the Rows shown, and the type and value filters are saved with the panel. On every plan.
  • Delivery view in Institutional Flow. A fourth view compares each NSE stock's end-of-day delivery with its own 20-session average. Spike lists delivery at least 2× the usual with the delivered share at or above its average, which leaves out intraday volume bursts; High % lists stocks with 60% or more of the day's volume taken for delivery; Up on delivery and Down on delivery list closes higher or lower on a delivery spike of 1.5× or more. A turnover floor from ≥ ₹1 cr to ≥ ₹100 cr drops thinly traded names, and each row's delivery % bar has a tick at the stock's own average.
  • Symbols open in linked panels. A symbol in the Market Calendar, the Smart Money table or the Delivery table opens in the panels sharing that panel's link colour, as the Watchlist does, or in a new chart when the panel is not linked.
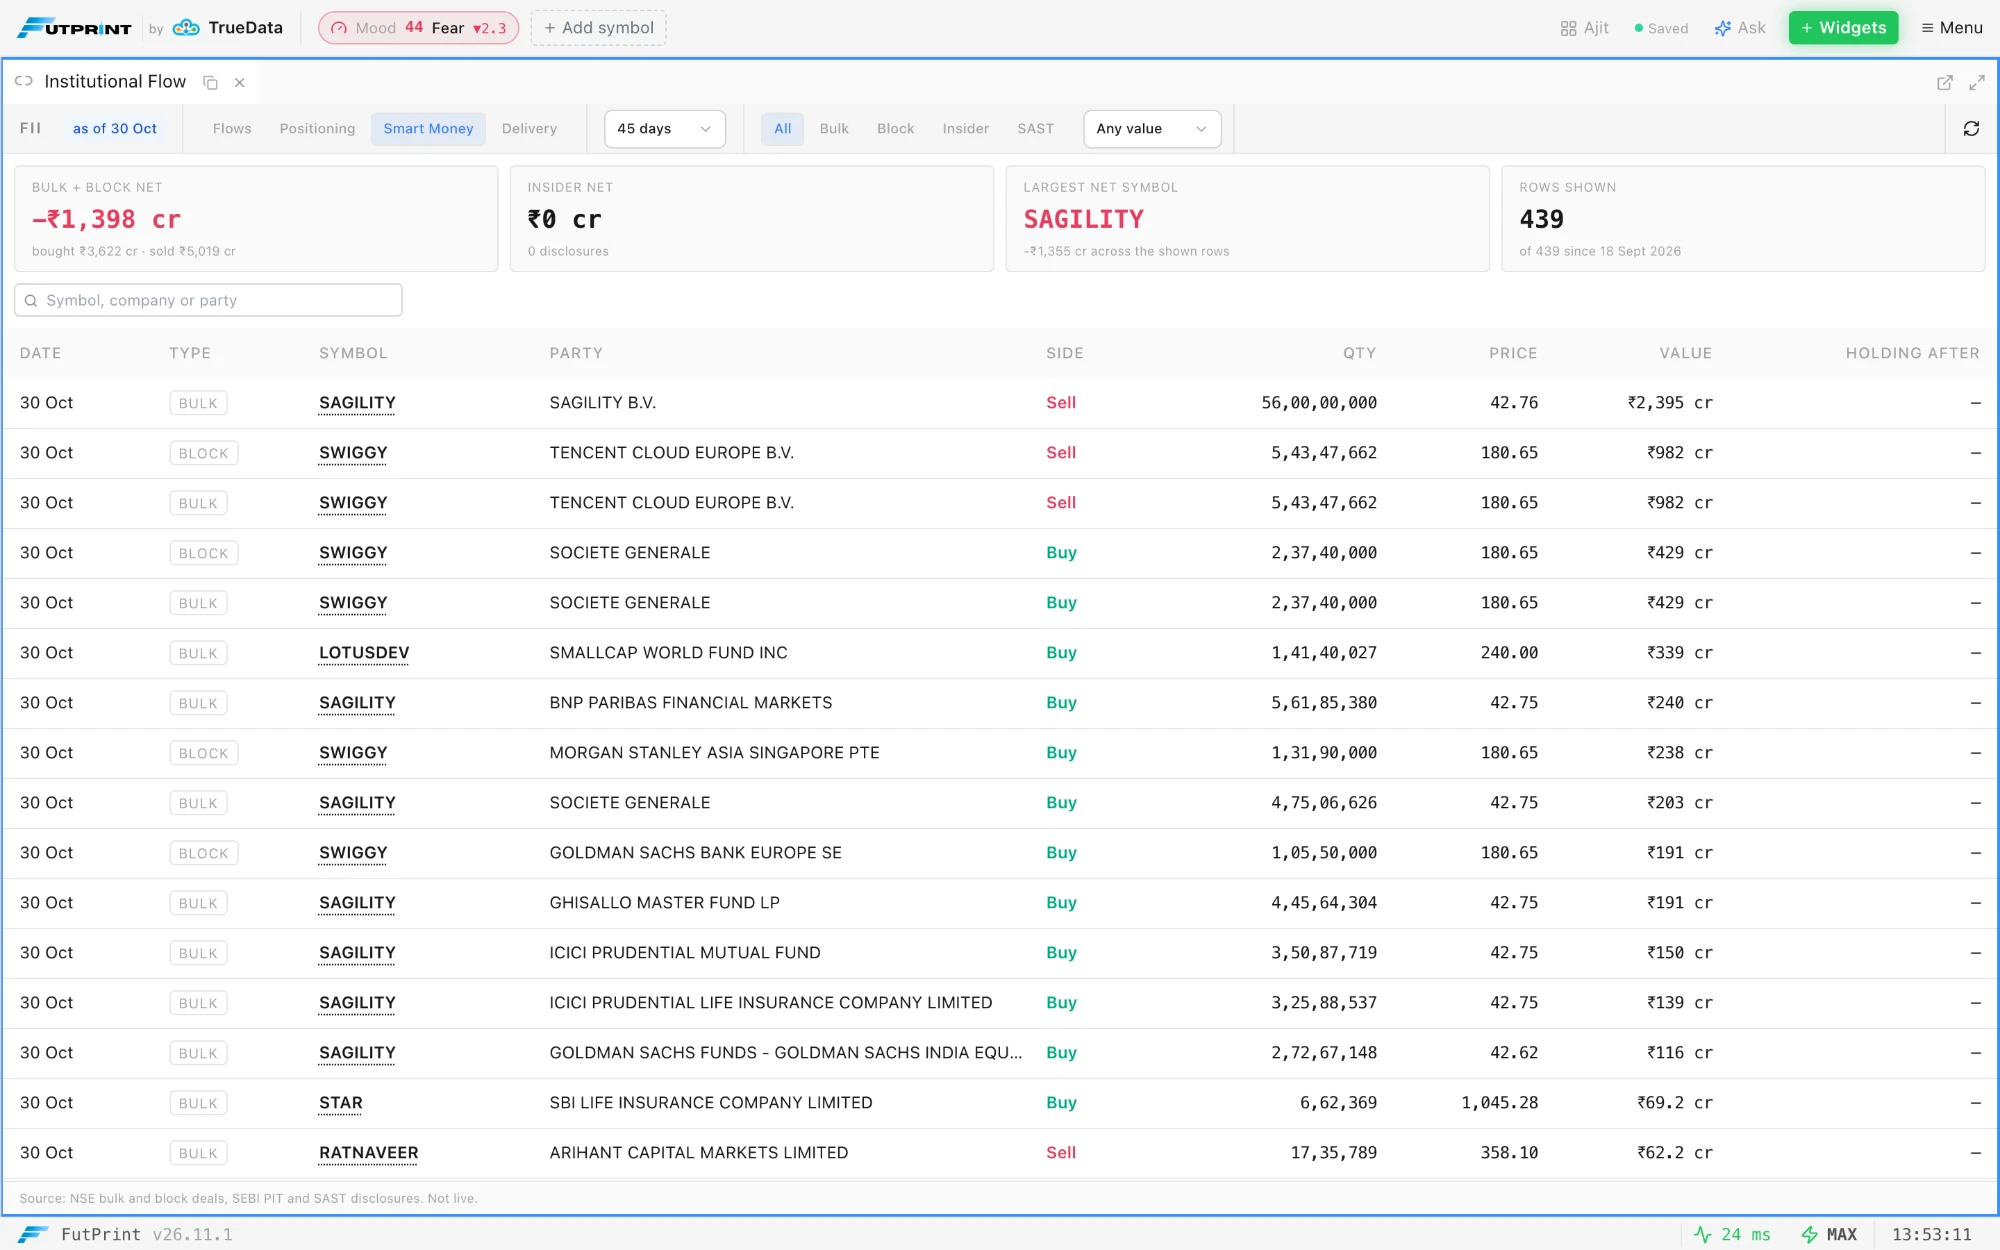
The Institutional Flow panel maximised on its Smart Money view over 45 days: the All, Bulk, Block, Insider and SAST pills, the minimum-value menu and search box, cards for the bulk and block net of −₹1,398 cr, the insider net, the largest net symbol and 439 rows shown, and the table of 30 October deals with date, type, symbol, party, side, quantity, price, value and holding after.
Smart Money in Institutional Flow: bulk and block deals, insider trades and SAST filings in one table.
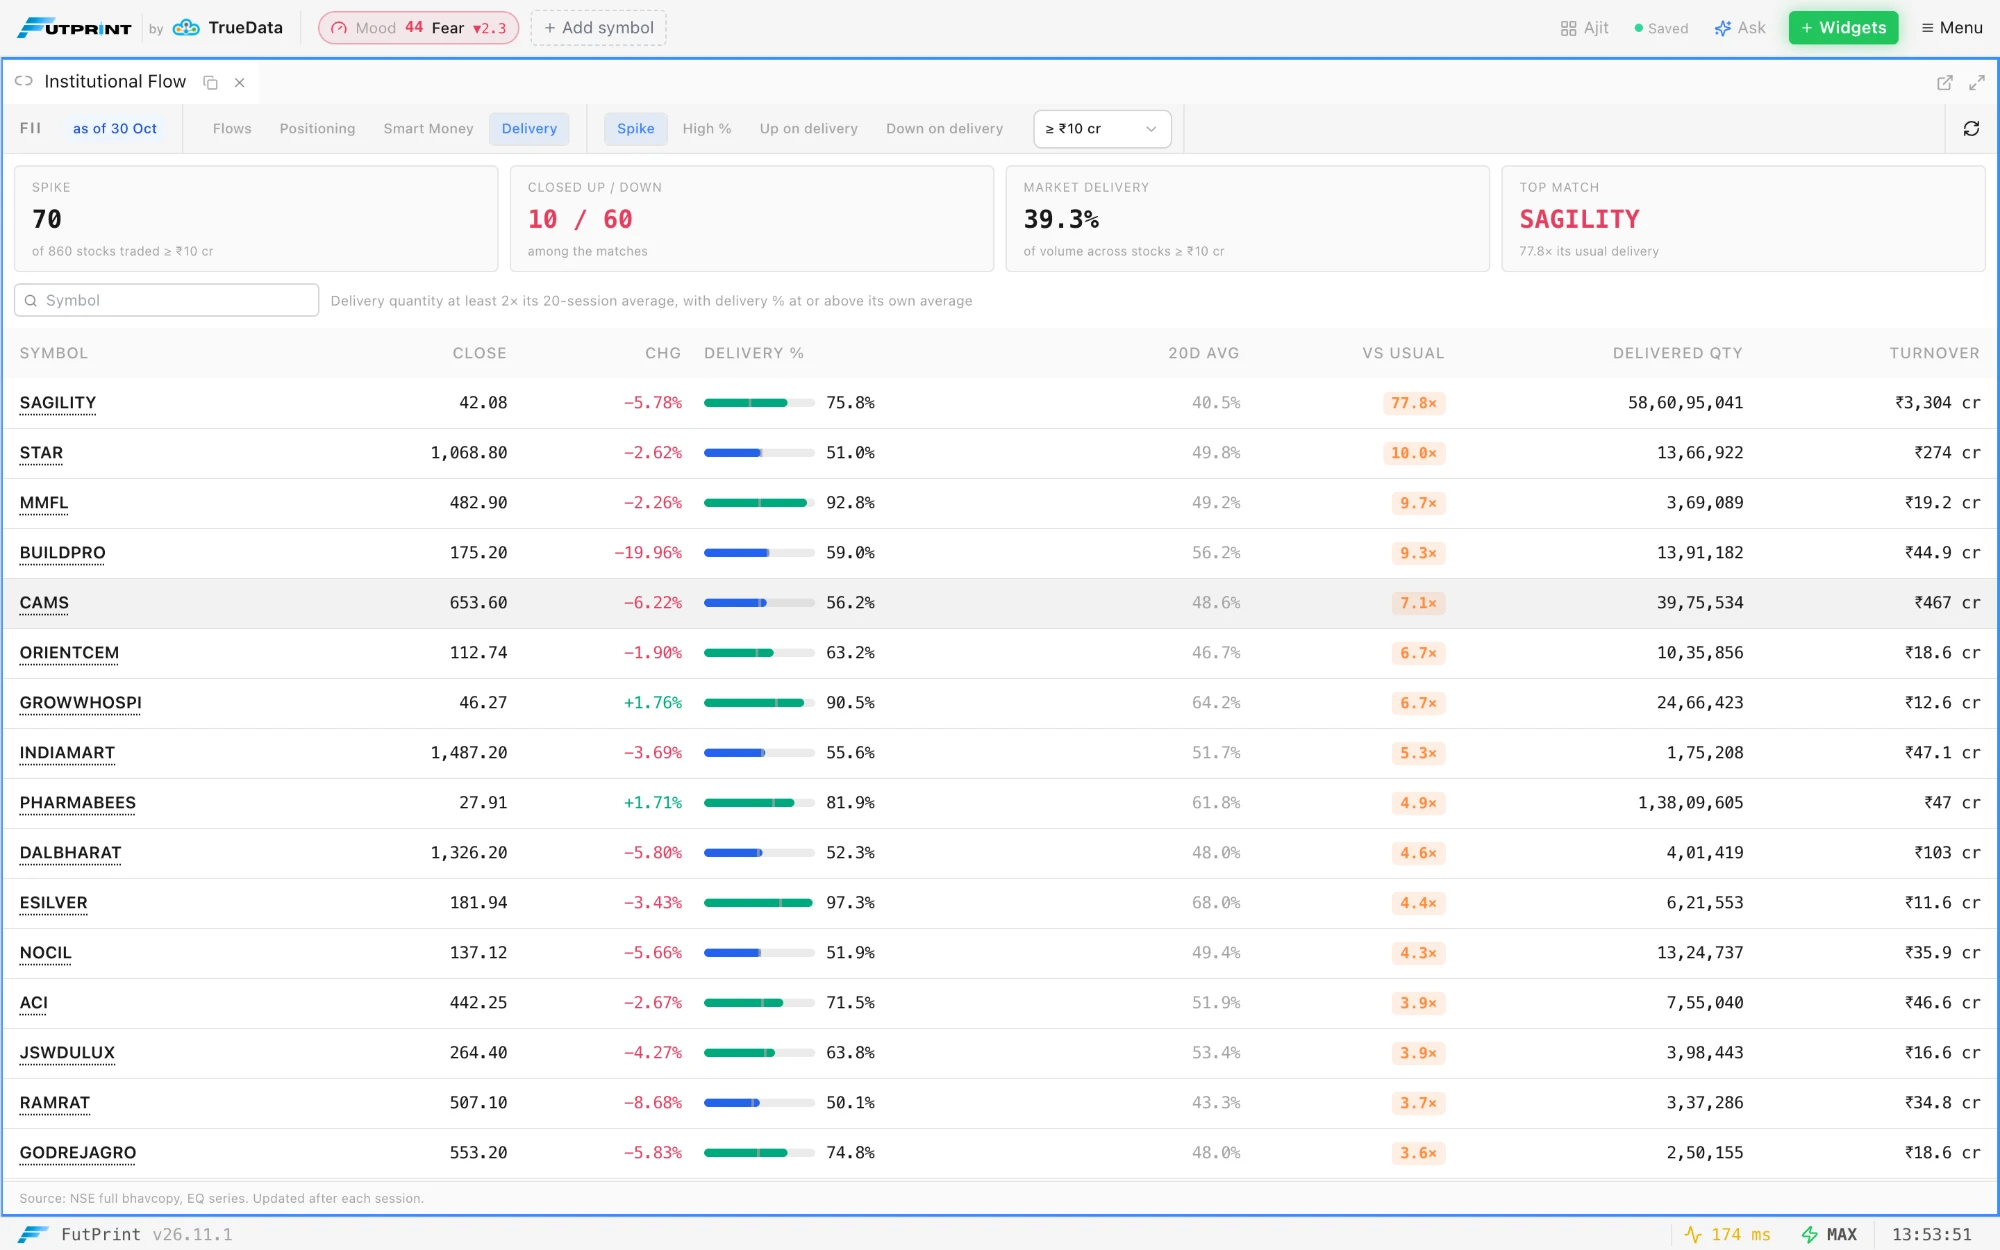
The Institutional Flow panel on its Delivery view with the Spike preset and a ₹10 cr turnover floor: cards for 70 spikes of 860 stocks, 10 closed up and 60 down, market delivery of 39.3% and the top match at 77.8× its usual delivery, above stocks ranked by delivery against their 20-session average with a delivery % bar each.
The Delivery view: each stock's delivery against its own 20-session average.

Fixed

  • Price axis after a symbol switch. Once the price scale had been set by hand, by a wheel or drag on the price axis or a vertical drag of the chart, switching the chart to another symbol could keep the old symbol's price range, so going from NIFTY to ITC left the new candles off screen. The new symbol is now framed on arrival. Charts on auto-scale were not affected.
  • Option chains for far expiries. Picking an expiry more than three months out, such as the NIFTY 30 Mar 2027 quarterly, gave an empty Option Chain ("No options found for selected expiry"), and Options Print, Depth of Market and the Option Strikes Profile and Gamma Blast studies went blank for it too. Every listed expiry now loads.
October 2026

26.10.30Release

Ask FutPrint answers how-do-I questions from the guides, Compose with AI writes scripts in the Script Editor, and the Heatmap replays the session

A new Ask button in the header opens a help assistant that answers questions about using FutPrint from the guides, on every plan, and links the page each answer rests on. Describe an indicator or strategy in plain words and the Script Editor writes the OpenScript for you on the Pro and Max plans. The Heatmap replays the session minute by minute, and the Add widget drawer gains search and even cards.

New

  • Ask FutPrint. The Ask button in the header, beside Widgets, opens a drawer where you ask how to do something in the terminal in plain words: "how do I add a column to the Watchlist", "where is the imbalance threshold", "how do I replay yesterday's session". The answer is drawn from the FutPrint guides, names controls as the app names them, and ends with Read more links that open the page it rests on in a new tab. The assistant knows which panel was focused when you opened it, so "where is that setting" is read against that panel, and the starter questions follow the panel too. It answers only questions about using FutPrint: it gives no trading advice or market views, and when the guides do not cover a question it says so, under a Not covered by the guides label, rather than guessing. Included in every plan with forty quick answers a day; after that it answers one question a minute, up to three hundred a day, resetting at midnight IST. The conversation stays in the browser tab until you press Clear conversation; questions and answers are stored with your account so the team can improve the guides. Ask FutPrint in the workspaces guide.
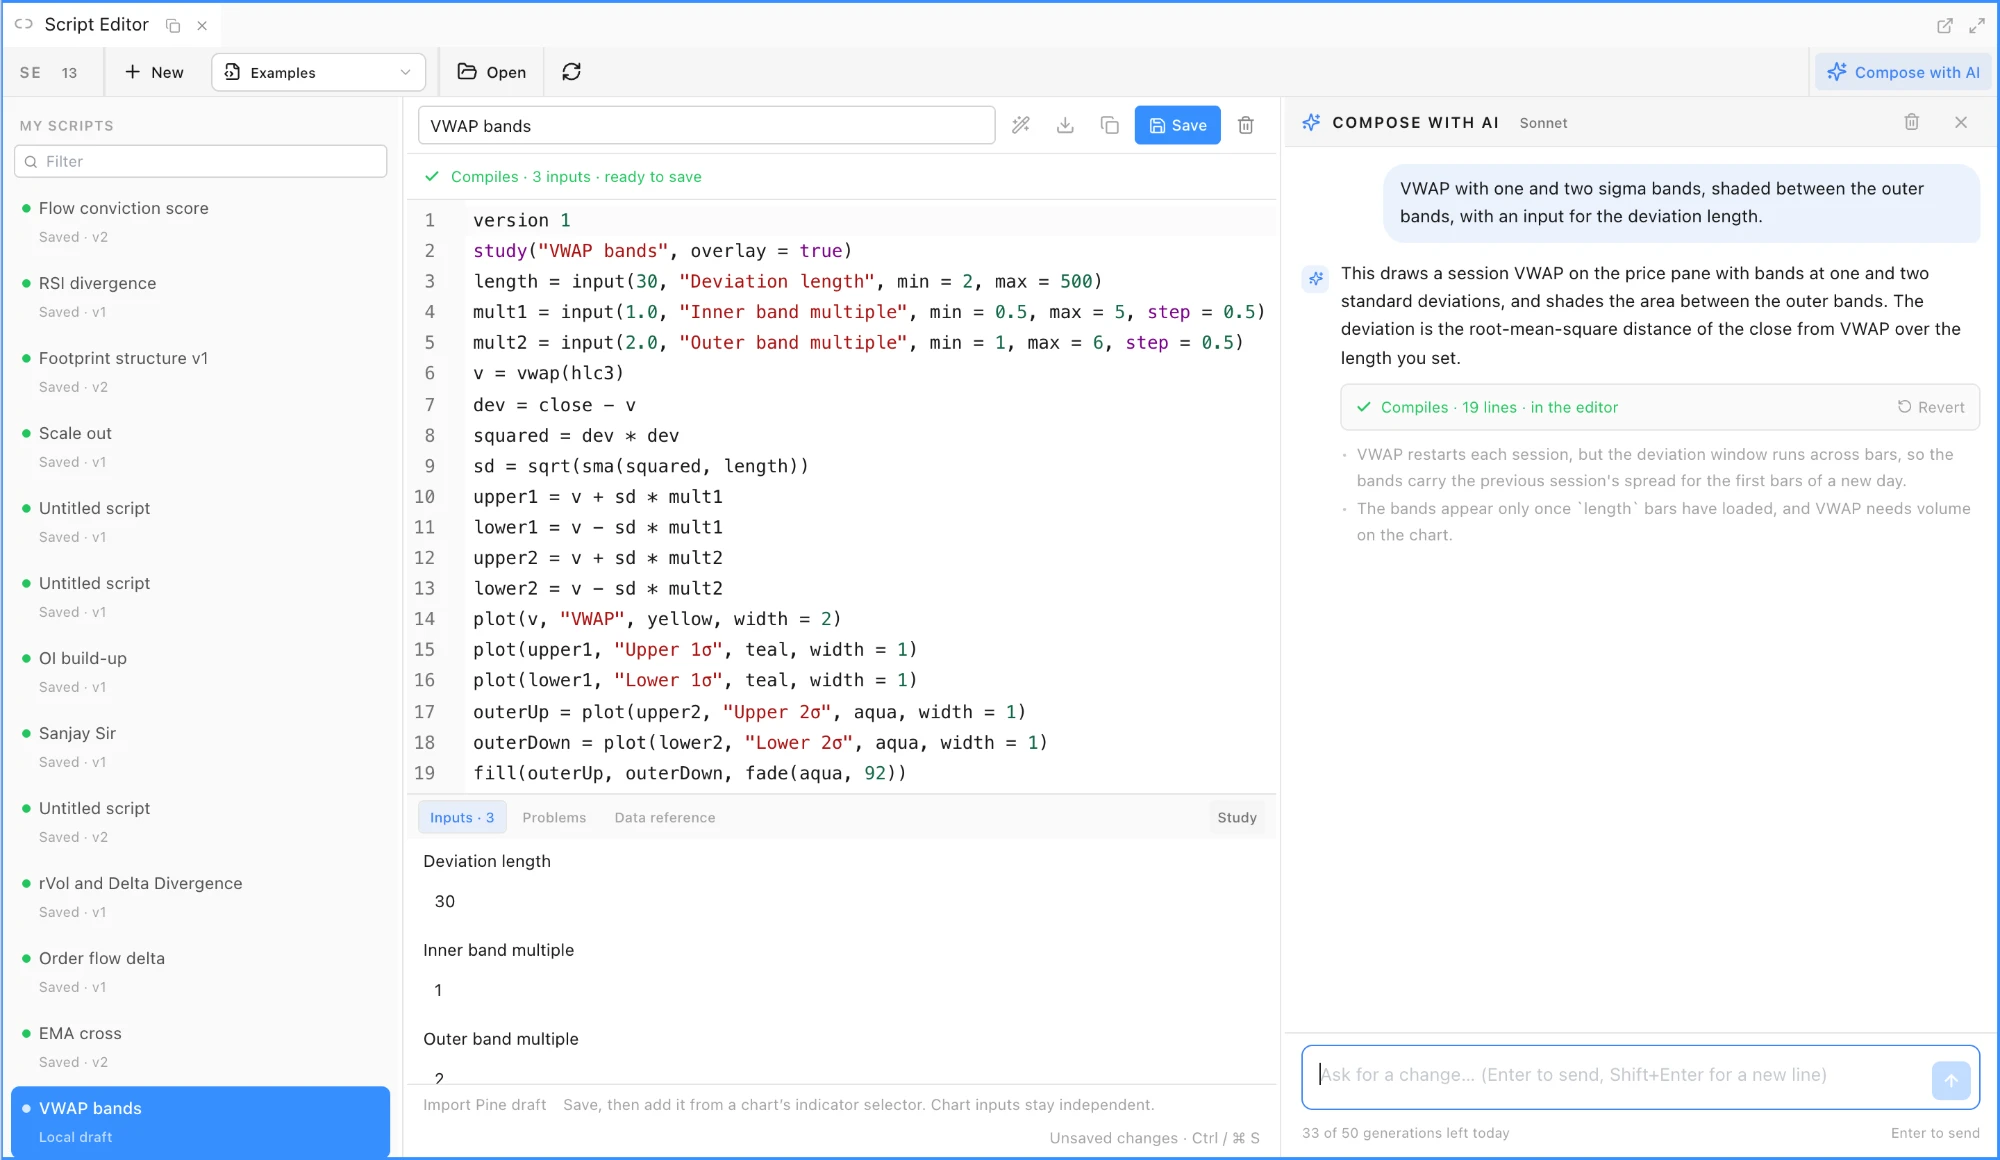
  • Compose with AI in the Script Editor (Widgets ▸ Charting & Analysis) writes OpenScript indicators and strategies from a plain-language description, or revises the script in the editor when you ask for a change. Press Compose with AI in the toolbar for a conversation beside the editor with Try one starters for price studies, order flow, open interest and strategies. The reply is typed into the editor as it streams; Skip shows it all at once and Stop (Esc) keeps what has arrived. When the last line lands the compiler runs: if it compiles, the status bar reads Compiles · 3 inputs · ready to save and the Inputs tab lists them; if not, the composer sends the compiler's problems back once by itself and asks for a corrected script, and after that Ask AI to fix is a button. Revert on any reply puts the previous version back, an untitled script takes the title the reply declares, and nothing reaches your account until you press Save. Each request carries your words, the script in the editor and the earlier turns of that conversation; your charts, account and saved scripts are not sent. The composer writes and revises scripts only: questions about the language, the data or the library get a short answer, and anything else gets a one-line reply that still counts toward the day's allowance. Included in the Pro and Max plans, trials too, with fifty generations per account per day that reset at midnight IST; the remaining count shows under the prompt box. Script Editor guide.
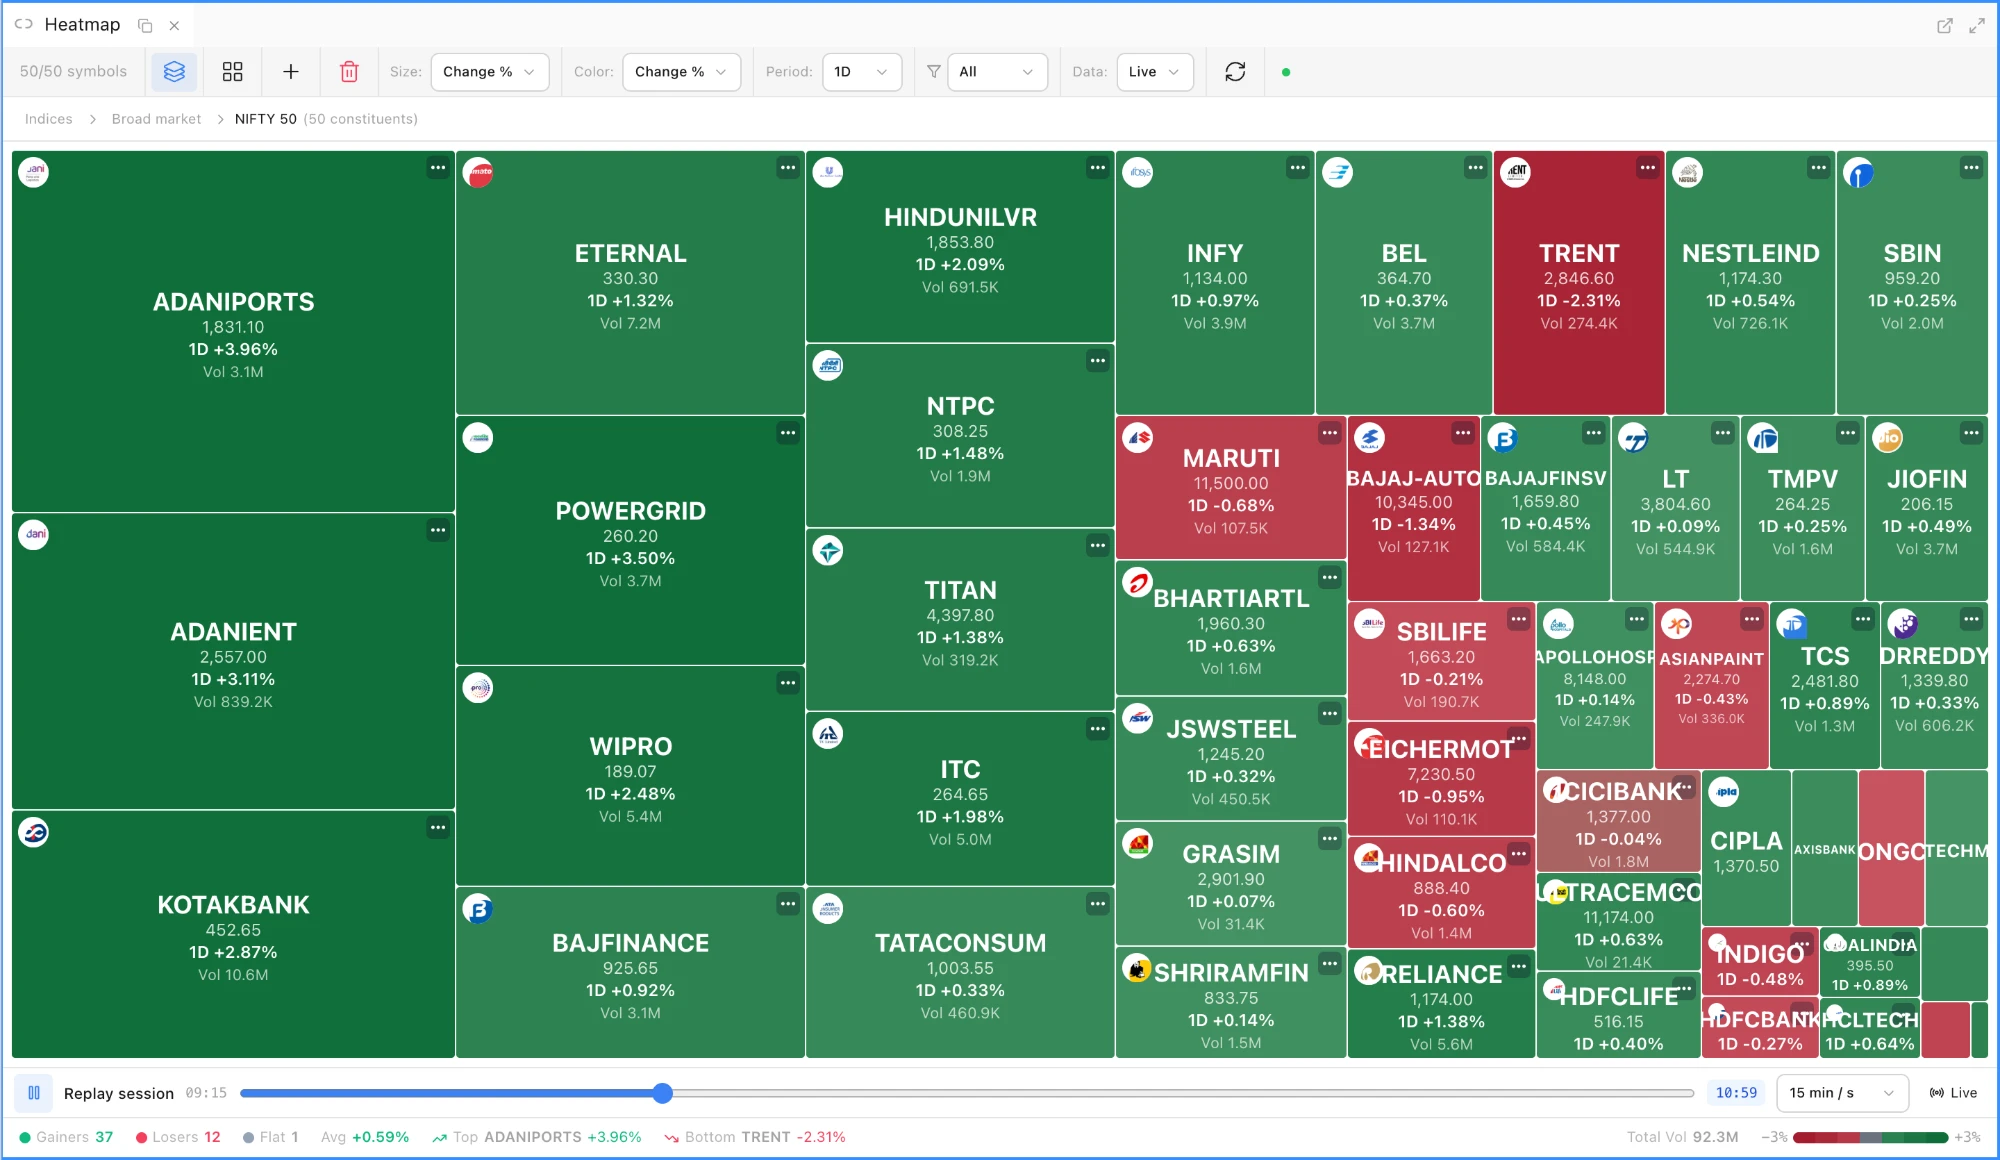
  • Replay session in the Heatmap. A bar under the treemap has play and pause, a scrubber across the session's minutes, a Playback speed of 5 min / s, 15 min / s, 30 min / s or 1 hr / s, a clock, and a Live (or Close) button back to the current values. Pressing play or dragging the scrubber loads every tile's one-minute bars for the day, today with Data: Live or the picked date with Data: Hist, eight symbols at a time with the progress shown in the bar. Change %, price and volume then replay minute by minute from 09:15 to the last bar and the stats footer follows. Tile sizes hold the session-end layout, so tiles stay put and only colours and labels move. 5m to 4H and Gap are measured within the session; 1W and 1M cannot be, so a replay shows 1D for those and labels it so. Heatmap guide.
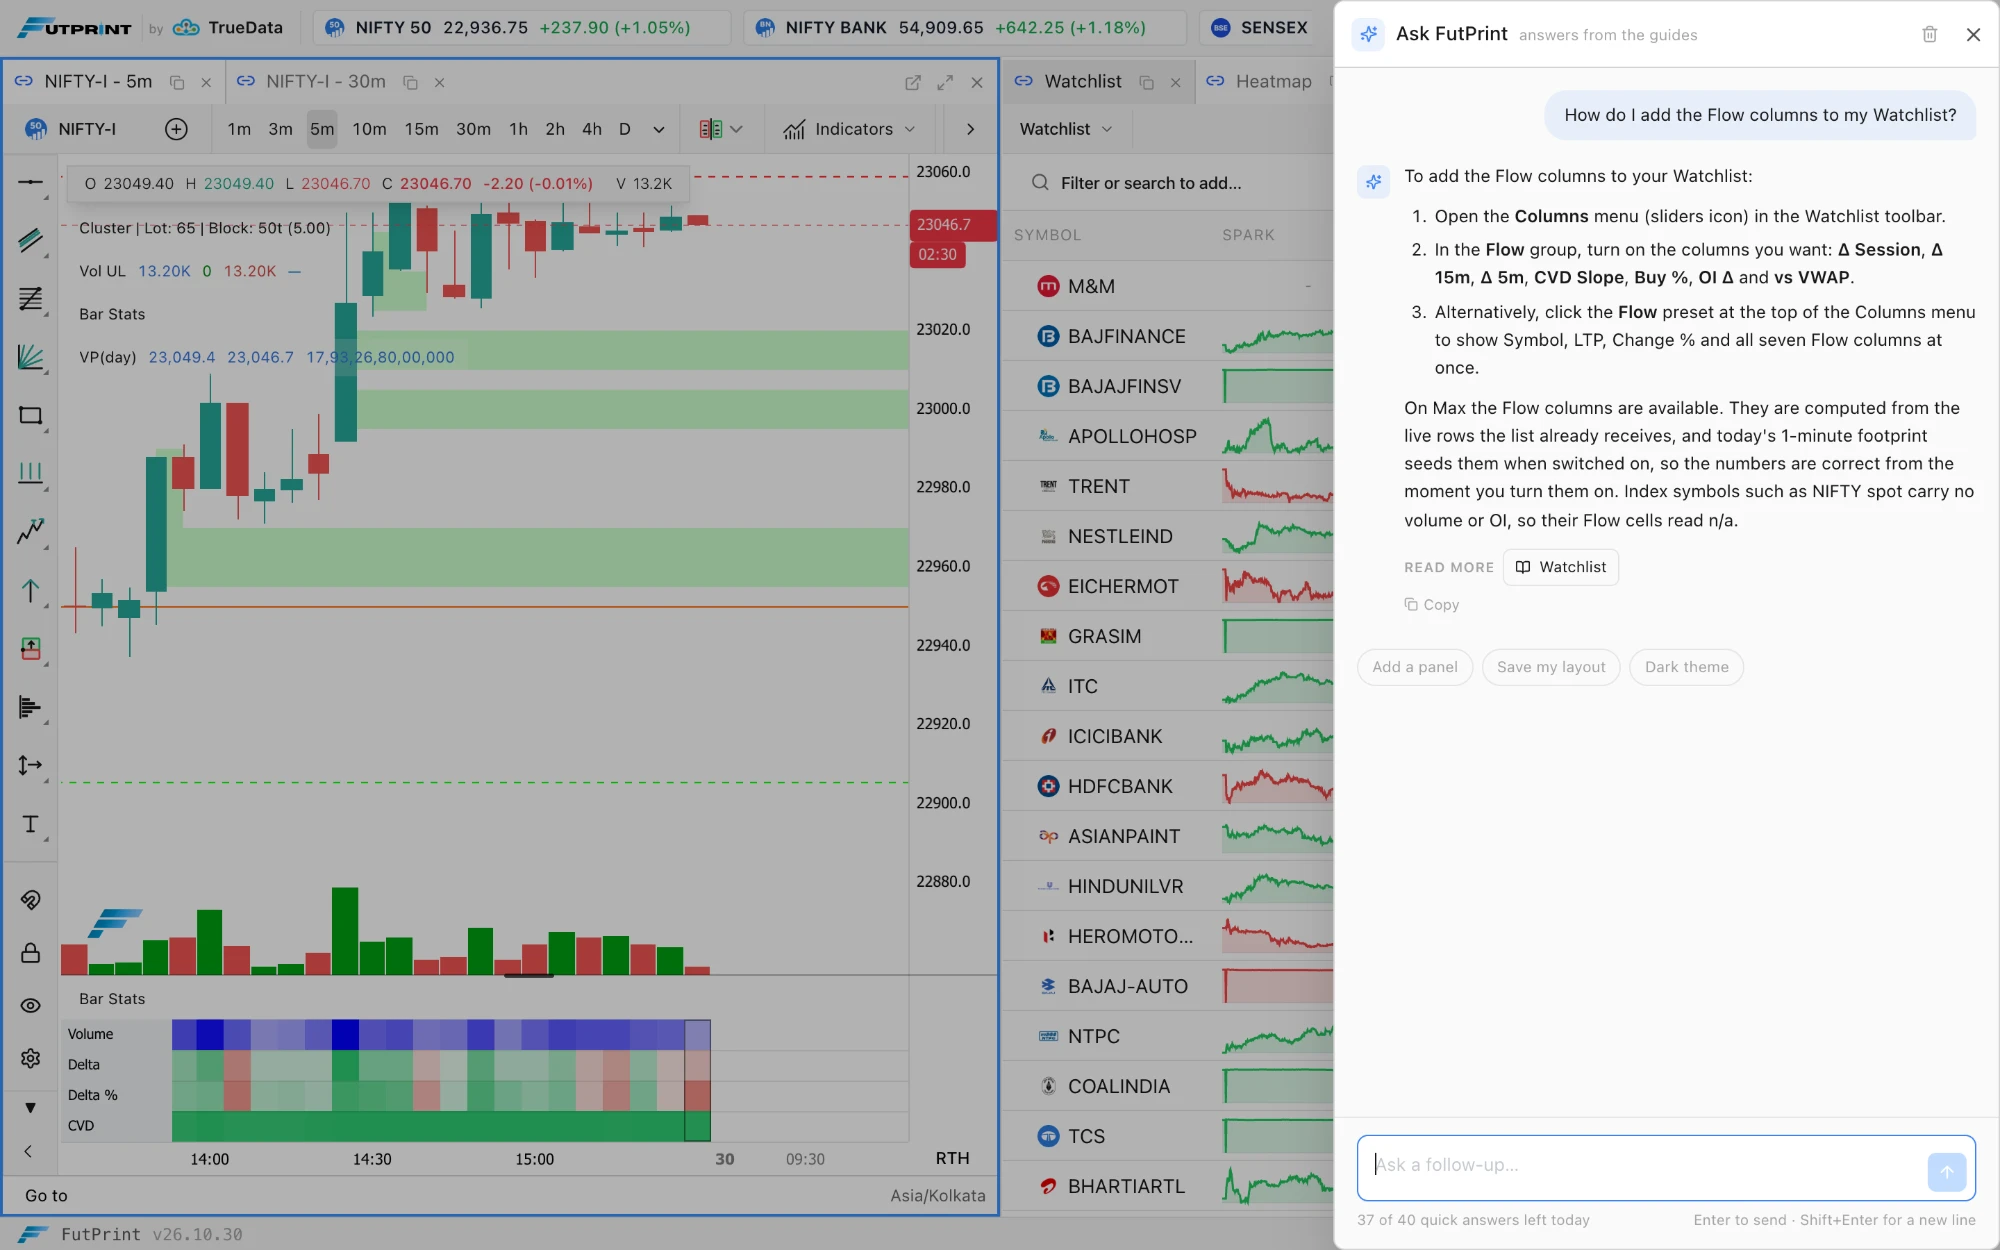
The FutPrint workspace in the light theme with the Ask FutPrint drawer open on the right: the question "How do I add the Flow columns to my Watchlist?", a three-step answer naming the Columns menu, the Flow group's seven columns and the Flow preset, a Read more chip linking the Watchlist guide, and the status line reading 37 of 40 quick answers left today.
Ask, beside Widgets: the answer comes from the guides and links the page it rests on.
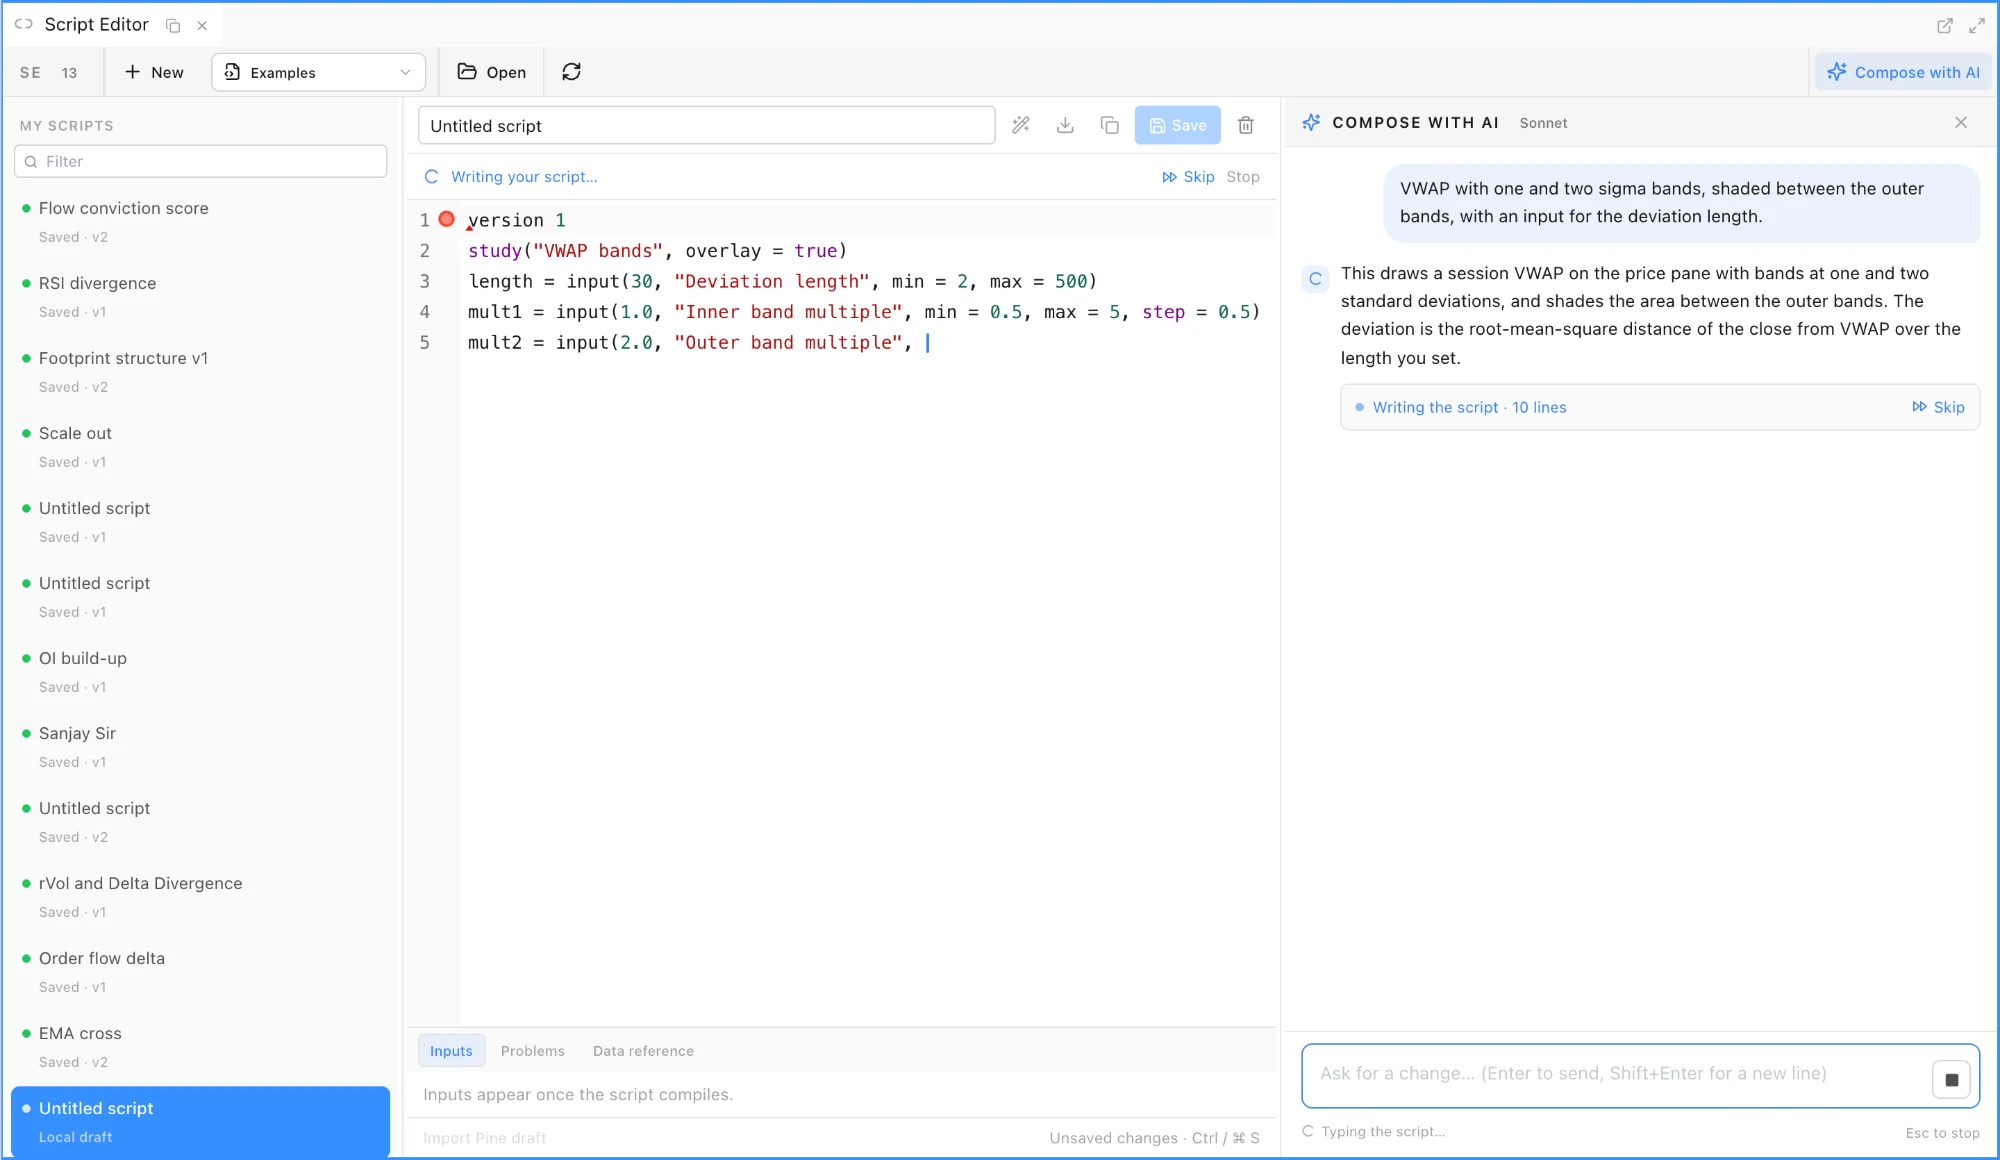
The Script Editor maximised in the FutPrint workspace, light theme: the request "VWAP with one and two sigma bands, shaded between the outer bands, with an input for the deviation length" in the Compose with AI column on the right, and the reply being typed into the editor line by line with Skip and Stop in the status bar.
The reply is typed into the editor as it streams; Skip shows it all at once and Stop keeps what has arrived.
The same Script Editor a moment later: the status bar reads "Compiles · 3 inputs · ready to save", the Inputs tab lists Deviation length, Inner band sigma and Outer band sigma, the composer shows the AI's two-sentence summary, its notes and a Revert button, and "33 of 50 generations left today" sits under the prompt box.
When the last line lands the compiler runs. The inputs appear below the editor and the reply carries Revert.
The Heatmap maximised on NIFTY 50 constituents during a session replay: solid red and green tiles sized by market cap with their change %, one hovered tile ringed, and the Replay session bar under the treemap with the pause button, the scrubber part-way through the session, the replay clock, the 15 min / s speed and the Live button.
Replay session under the treemap: the scrubber, the clock and the speed, with tiles holding their places as the colours move.

Improved

  • Script Editor in three columns. Your scripts with a filter on the left, the editor in the middle with Inputs, Problems and Data reference tabs beneath it and a Study or Strategy pill, and the composer on the right, each column resizable. Saving, Examples, Open, Import Pine draft and local drafts work as before.
  • Heatmap colours. Tiles are solid red or green from the first tick and deepen with the size of the move on a fixed scale for each period, ±3% for 1D, ±0.5% for 5m and ±12% for 1M, with a legend in the footer. Before, a translucent ramp from grey left most tiles faint and the scale was refit to the data every frame. Each tile's label colour is picked against its own fill, so the change % reads on every shade, and the tile under the pointer gets a ring and a slight lift.
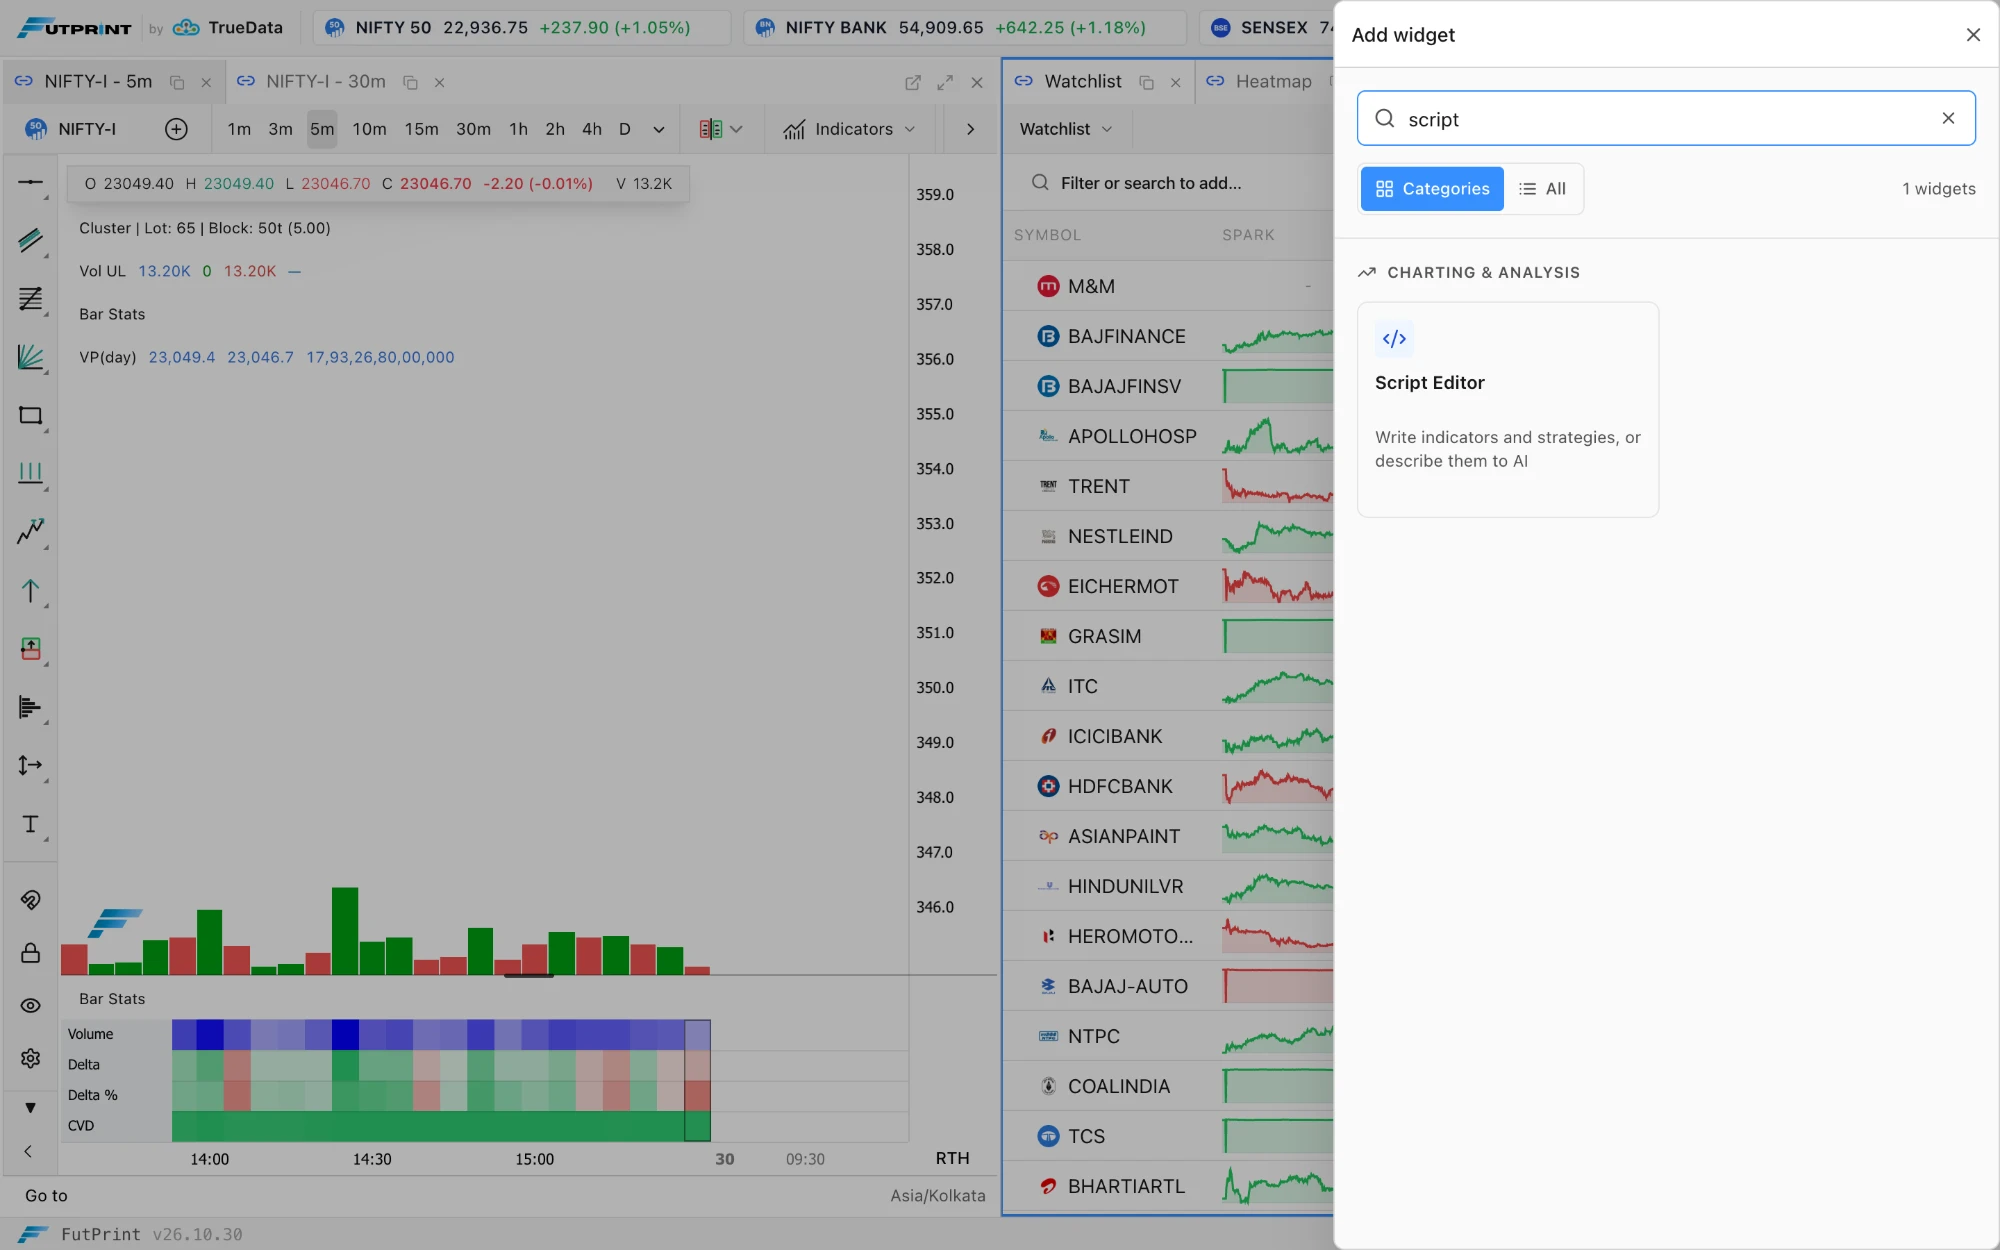
  • Add widget drawer. The Widgets button opens a drawer with a Search widgets box, Categories and All views and a count of what matches; all 27 widget cards share one height with a short description and an icon, and keyboard focus returns to where it was when the drawer closes. Working with panels.
  • One typeface across the terminal. The header, the menu and the widget drawer now use the terminal's sans-serif face instead of a monospace one; ticker prices keep tabular digits so their widths stay stable. The Menu has larger click targets, clearer status badges and scrolls within the viewport.
The Add widget drawer open over a FutPrint workspace with a NIFTY futures cluster chart and the Watchlist behind it: the Search widgets box holds "script", the Categories and All switch shows 1 widget, and one card, Script Editor, "Write indicators and strategies, or describe them to AI", sits under Charting & Analysis.
Widgets opens a drawer: type to search, or browse the categories.
26.10.28Major release

The Strategy Tester, 15s and 30s bars, Expiry Day and Futures Term panels, and each symbol's own tick

OpenScript strategies now backtest on the chart in a new Strategy Tester, with estimated Indian F&O charges and stops and targets that fill inside the bar. Charts gain 15-second and 30-second bars, two new panels follow expiry day and the futures roll, the Watchlist gains order-flow columns, indicator panes fit their data and keep their heights, and every chart now uses its own symbol's exchange tick instead of 0.05.

New

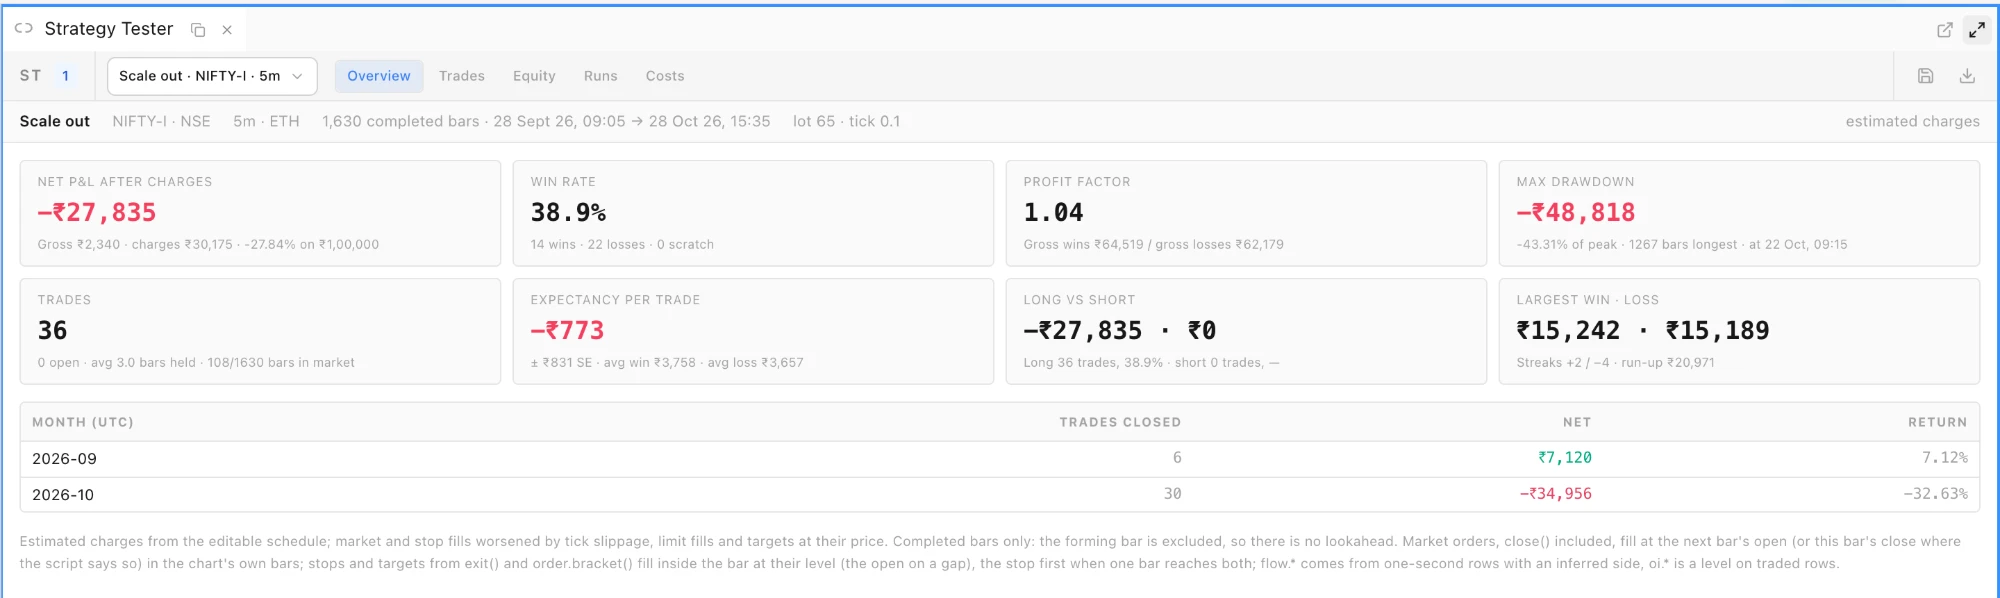
  • Strategy Tester, under Widgets ▸ Charting & Analysis, backtests any OpenScript script that declares strategy() once you apply it to a chart from Indicators ▸ My Scripts. It runs on completed bars only, so there is no lookahead, and re-runs by itself whenever the chart's bars change. Overview shows net P&L after charges, win rate, profit factor, max drawdown, expectancy, long versus short and a month-by-month table; Trades lists every round trip with its excursions, and a click scrolls the chart to the entry; Equity draws the equity curve and drawdown; Runs saves and exports run records; Costs holds an editable charge schedule per profile (NSE, BSE and MCX futures and options, and equity intraday) with brokerage, STT or CTT, exchange and SEBI charges, stamp duty, GST and slippage in ticks. Entries and exits are marked on the chart. Stops and targets from exit() and order.bracket() fill inside the bar at their level (at the open on a gap), and when one bar reaches both, the stop is taken. Pro and Max. Strategy Tester guide.
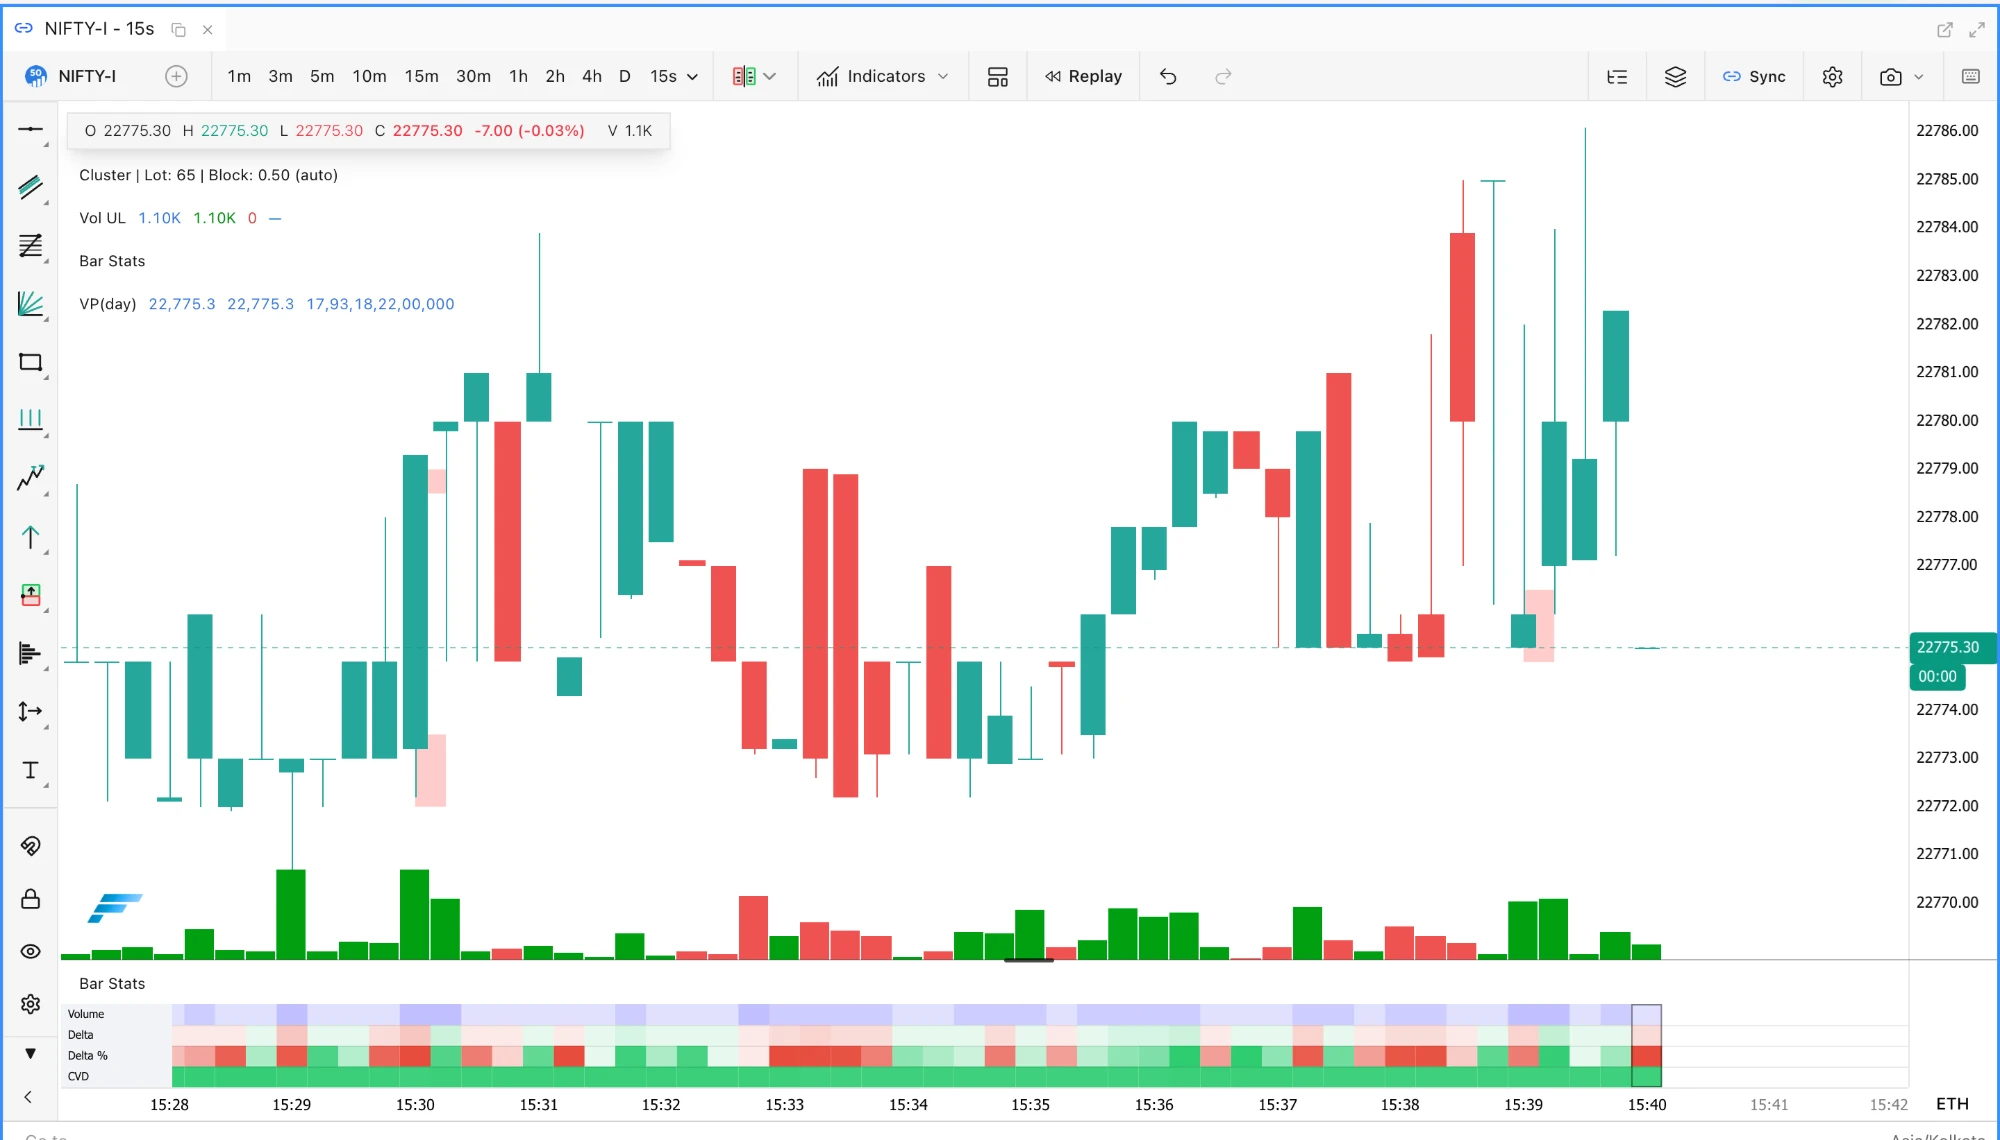
  • 15s and 30s bars. The interval menu has a new Seconds · one-second rows group with 15s and 30s. These bars are built in the browser from the feed's one-second rows, with volume, inferred delta, CVD and open interest on every bar, and they work with Renko, P&F and Kagi. An alert created from a seconds chart is evaluated on 5m bars on the server, and the alert dialog says so. Pro and Max.
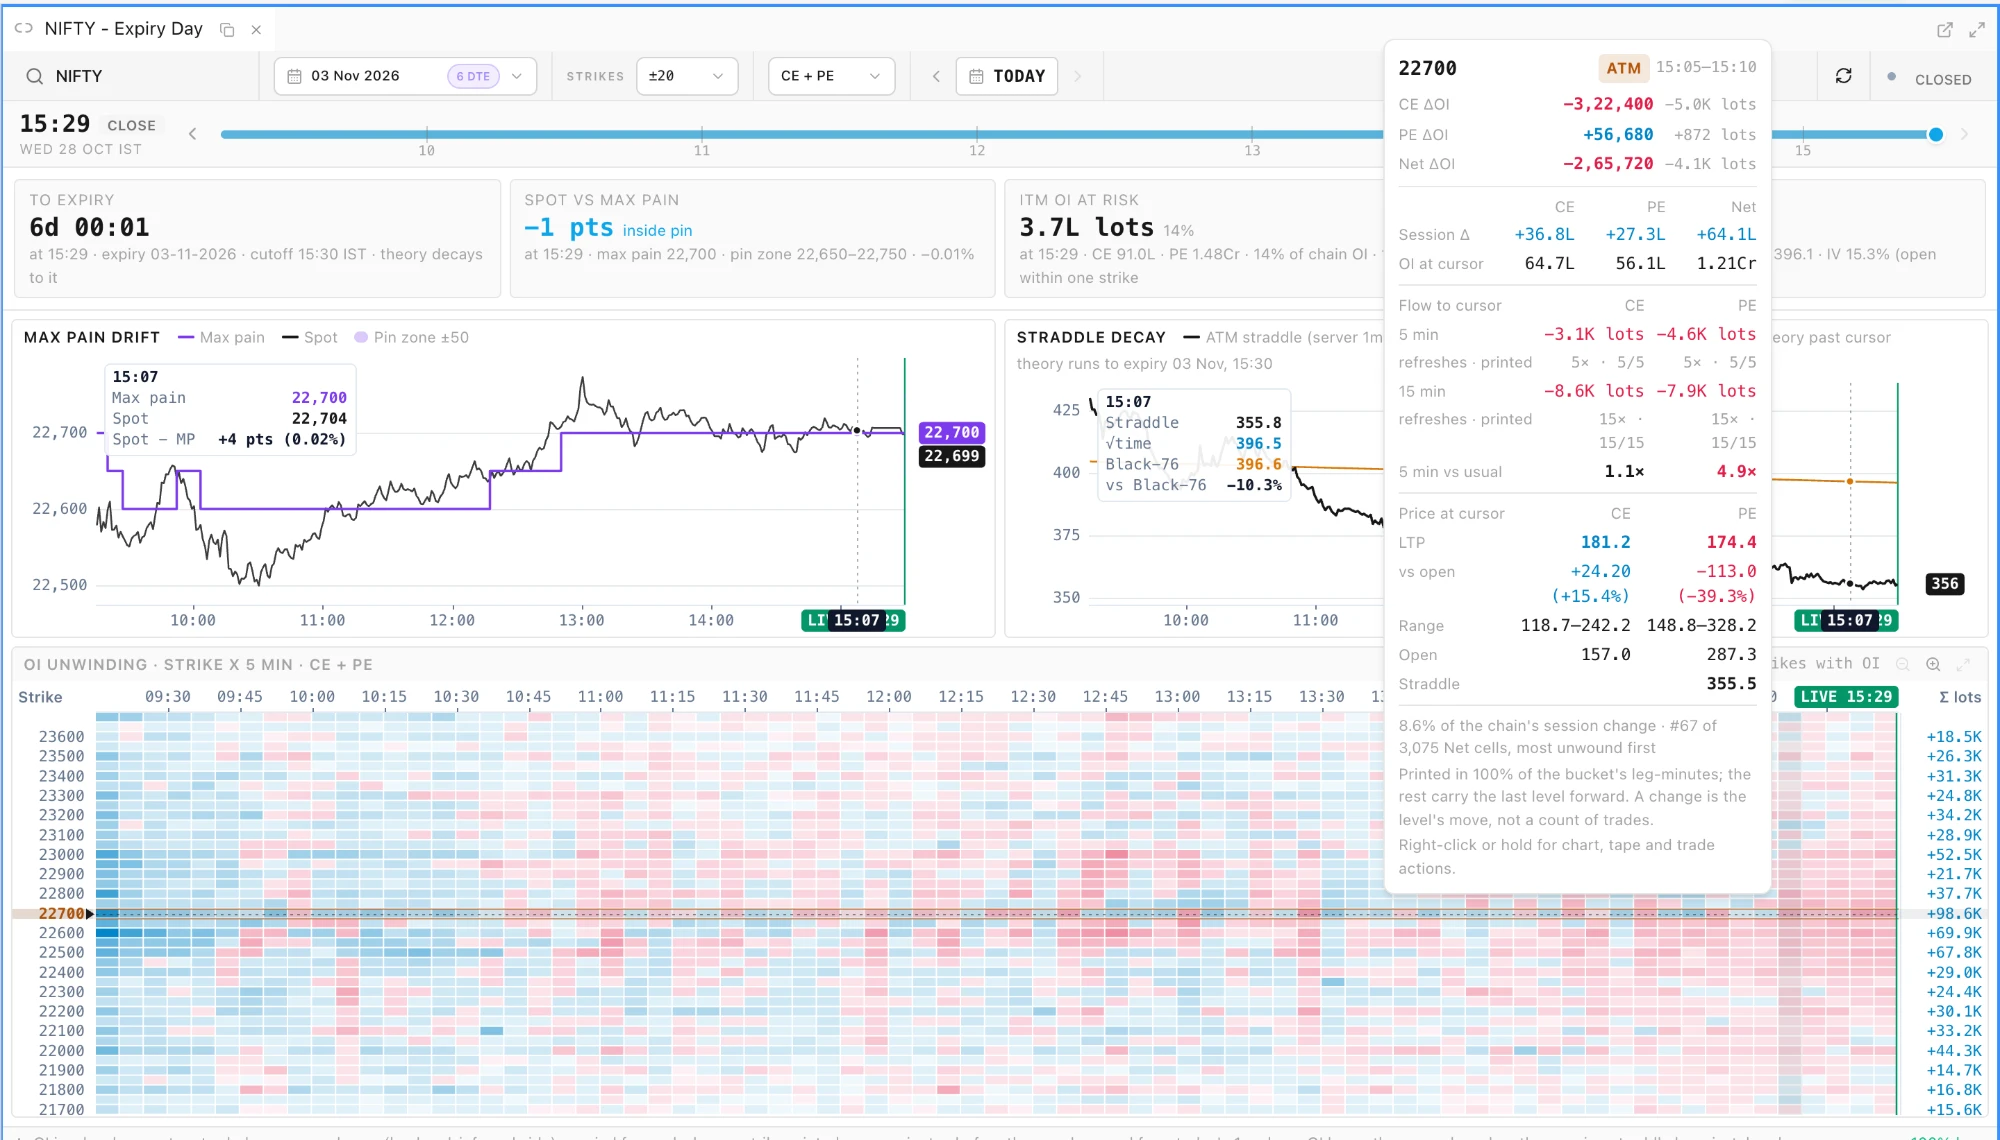
  • Expiry Day panel, under Widgets ▸ Options Trading, follows an expiring index through the session, live or replayed on a past trading day. Its cards show the time to the cutoff, spot against max pain, ITM open interest at risk and straddle decay. Two charts track max pain drift against spot and the ATM straddle against √time and Black-76 decay, and a strike-by-five-minute heatmap shows where open interest is unwinding. Hover a cell for a Flow to cursor readout per leg: the 5-minute and 15-minute OI change in lots, how often the level actually changed, and the 5-minute change against the strike's own usual. Cells whose change is at least twice their strike's usual are outlined, at most five at a time, and the outlines follow the CE + PE, Calls and Puts switch. Pro and Max. Expiry Day guide.
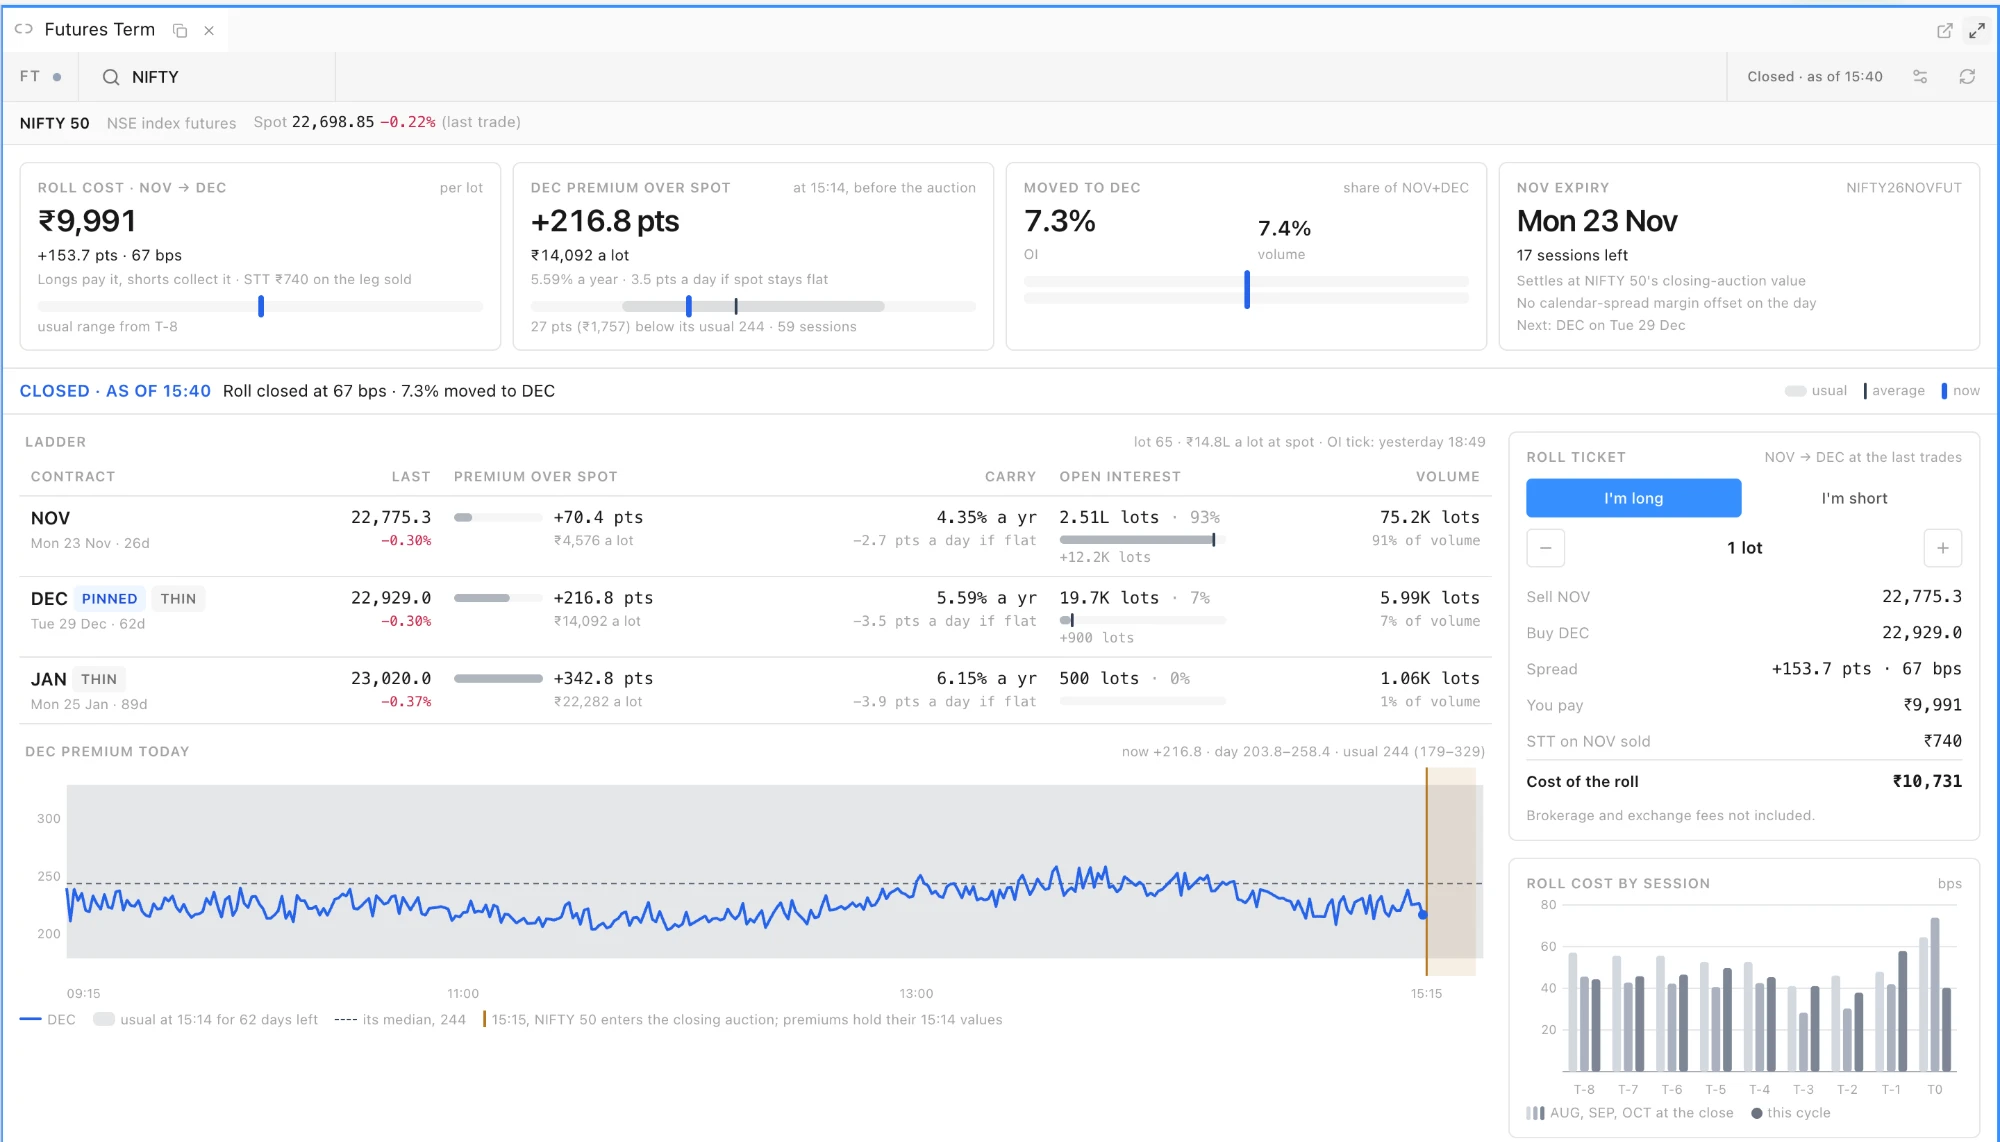
  • Futures Term panel, under Widgets ▸ Options Trading, reads an underlying's futures for the roll. Four cards show the Roll cost (₹ a lot, points, bps and STT on the leg sold), the premium over spot, the share of open interest and volume Moved to next month, and the near expiry, each on a meter with its usual range, average and current value. The roll cost and moved share are compared with the same session in the last three expiries, and the premium with the usual carry of contracts with about a month left. Below them are the expiry ladder (premium, carry, OI share and volume share, with Pinned, Settles today, Settled and Thin chips), a Roll ticket for a long or short roll, roll cost by session from T-8 to expiry and the premium through the day. From 15:15, while NSE spot is in its closing auction, premiums and carry hold their 15:14 values. On a phone, the panel switches to Ladder, Roll and Today tabs. Futures stream live on Pro and Max (MCX on Max); other plans see the last close. Futures Term guide.
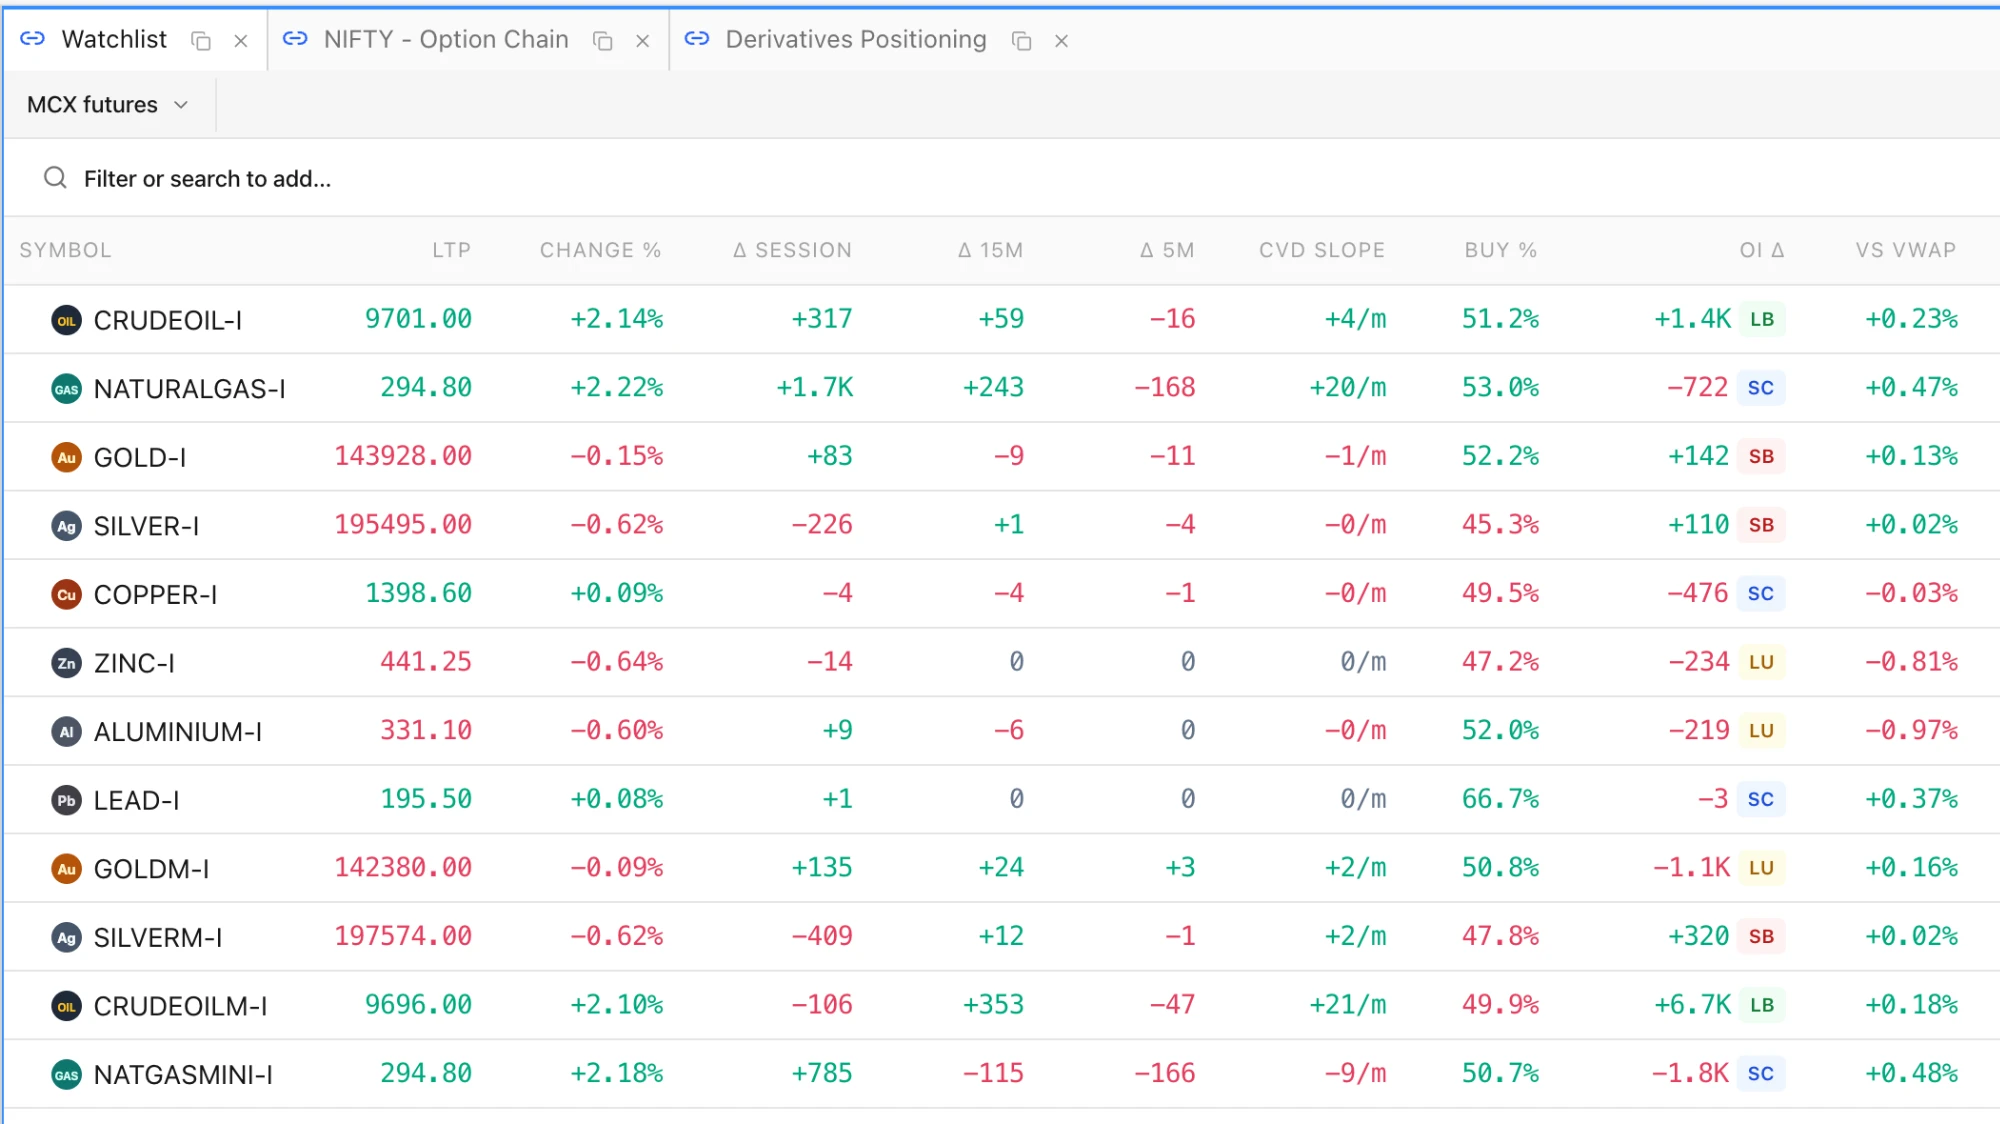
  • Flow columns in the Watchlist. Choose the Flow preset in Customize view (the column button in the Watchlist toolbar) for Δ Session, Δ 15m, Δ 5m, CVD Slope, Buy %, OI Δ with a long build-up, short build-up, short covering or long unwinding badge, and vs VWAP. The session columns are seeded from today's 1m footprint, and the side of each second is inferred from the one-second feed rows. Index symbols show n/a, since they carry no volume or open interest. Pro and Max. Watchlist guide.
The Strategy Tester panel on its Overview tab for the Scale out strategy on NIFTY-I 5m over 1,630 completed bars: cards for net P&L after charges of minus 27,679 rupees with gross 2,496 and charges 30,175, win rate 38.9%, profit factor 1.04, max drawdown, 36 trades, expectancy per trade, long versus short and largest win and loss, above a month-by-month table for September and October 2026.
The Strategy Tester's Overview for a strategy on NIFTY futures, with charges estimated from the Costs tab.
A NIFTY-I chart on 15s bars covering the last twelve minutes of the 28 October session, from 15:28 to 15:40, with volume bars and the Bar Statistics pane under the candles.
NIFTY futures on 15-second bars, built from the feed's one-second rows.
The Expiry Day panel for the NIFTY 3 November expiry on 28 October at 15:29: cards for 6 days to expiry, spot 1 point inside the max pain pin, 3.7 lakh lots of ITM open interest at risk and straddle decay of minus 10.2% against theory; the max pain drift and straddle decay charts; and the OI unwinding heatmap with a hover card on the 22700 ATM strike showing CE and PE OI change, the Flow to cursor block with 5 and 15 minute changes, refreshes and the 5 min vs usual multiples of 1.1 and 4.9, and the option prices at the cursor.
Expiry Day on NIFTY with the hover card on the ATM strike: the Flow to cursor block shows the 5 and 15 minute OI change per leg against its usual.
The Futures Term panel for NIFTY after the close: cards for a NOV to DEC roll cost of 9,991 rupees a lot (153.7 points, 67 bps), a DEC premium over spot of 216.8 points, 7.3% of open interest moved to DEC and the NOV expiry on Monday 23 November with 17 sessions left; the ladder of NOV, DEC and JAN with premium, carry, open interest and volume; the DEC premium through the day against its usual band; the roll ticket for a 1-lot long roll; and the roll cost by session from T-8 to T0 against August, September and October.
Futures Term on NIFTY: roll cost, premium and moved share against their usual ranges, the ladder, the roll ticket and roll cost by session.
A Watchlist of twelve MCX futures with the Flow columns: symbol, LTP, change %, delta for the session, the last 15 minutes and the last 5 minutes, CVD slope per minute, buy %, OI change with LB, SB, SC and LU badges, and the distance from VWAP. CRUDEOIL-I reads plus 317 for the session, plus 59 over 15 minutes, minus 16 over 5 minutes, 51.2% buy, plus 1.4K OI with a long build-up badge and 0.23% above VWAP.
The Flow preset on a Watchlist of MCX futures: delta over three windows, CVD slope, buy share, OI change with its build-up and the distance from VWAP.

Improved

  • Every chart uses its symbol's own tick. Charts assumed a 0.05 tick for every symbol; they now take each symbol's exchange tick from the symbol master (0.1 on NIFTY futures, 0.2 on BANKNIFTY futures, 1 on CRUDEOIL), and footprint rows, profiles, TPO, Tick Range, Renko, P&F, Kagi, Big Trades, the scanner, the Depth of Market ladder and the Tick Analyser all count in it. The price axis shows as many decimals as the tick, one on NIFTY futures. Settings that already counted ticks now count real ticks, so on NIFTY futures the footprint's Manual Bin Size (ticks), the TPO chart's Bin Size (ticks), and the Tick Range, Renko, P&F, Kagi and Fixed Range Volume Profile settings draw rows twice as tall as before; halve the number to keep the old size. Automatic and LTP-based footprint rows keep their size, rounded to whole ticks.
  • Profile bin sizes are set in ticks. The bin size override on Volume Profile, Stepped Volume Profile, Market Profile and FP Summary, and the TPO chart's volume profile, is now Bin Size (ticks). A size saved as a price converts once to the nearest whole number of ticks when the symbol's tick is known, so a profile keeps its rows: 4 points on NIFTY futures becomes 40 ticks. The DOM step and the Tick Analyser row size are numbers of ticks too, and the DOM shows a row for every tick by default. Volume Profile guide.
  • Value area from the bigger neighbour. Volume Profile (session, developing and composite) and Market Profile build the value area from the POC by adding whichever neighbouring row holds more volume, instead of adding a row above and a row below in turn. This matches the scanner and Footprint Summary, and moves VAH and VAL on many days.
  • Indicator panes fit their data. Each pane fits the bars on screen as you scroll; dragging, wheeling or pinching its axis fixes the range, and double-click, Reset scale, the 0 key or Auto-fit in the axis menu switch it back. RSI, Stochastic, MFI and ADX stay within 0 to 100, volume and histograms stand on zero, and standard levels are drawn (Stochastic 80/20, CCI ±100, zero lines on AO, ROC, TRIX, KST and Force Index). The price chart keeps at least 100 px; further panes fold behind a +N panes chip, and Hide All Panes in the chart menu hides them all. Pane heights are kept with the workspace.
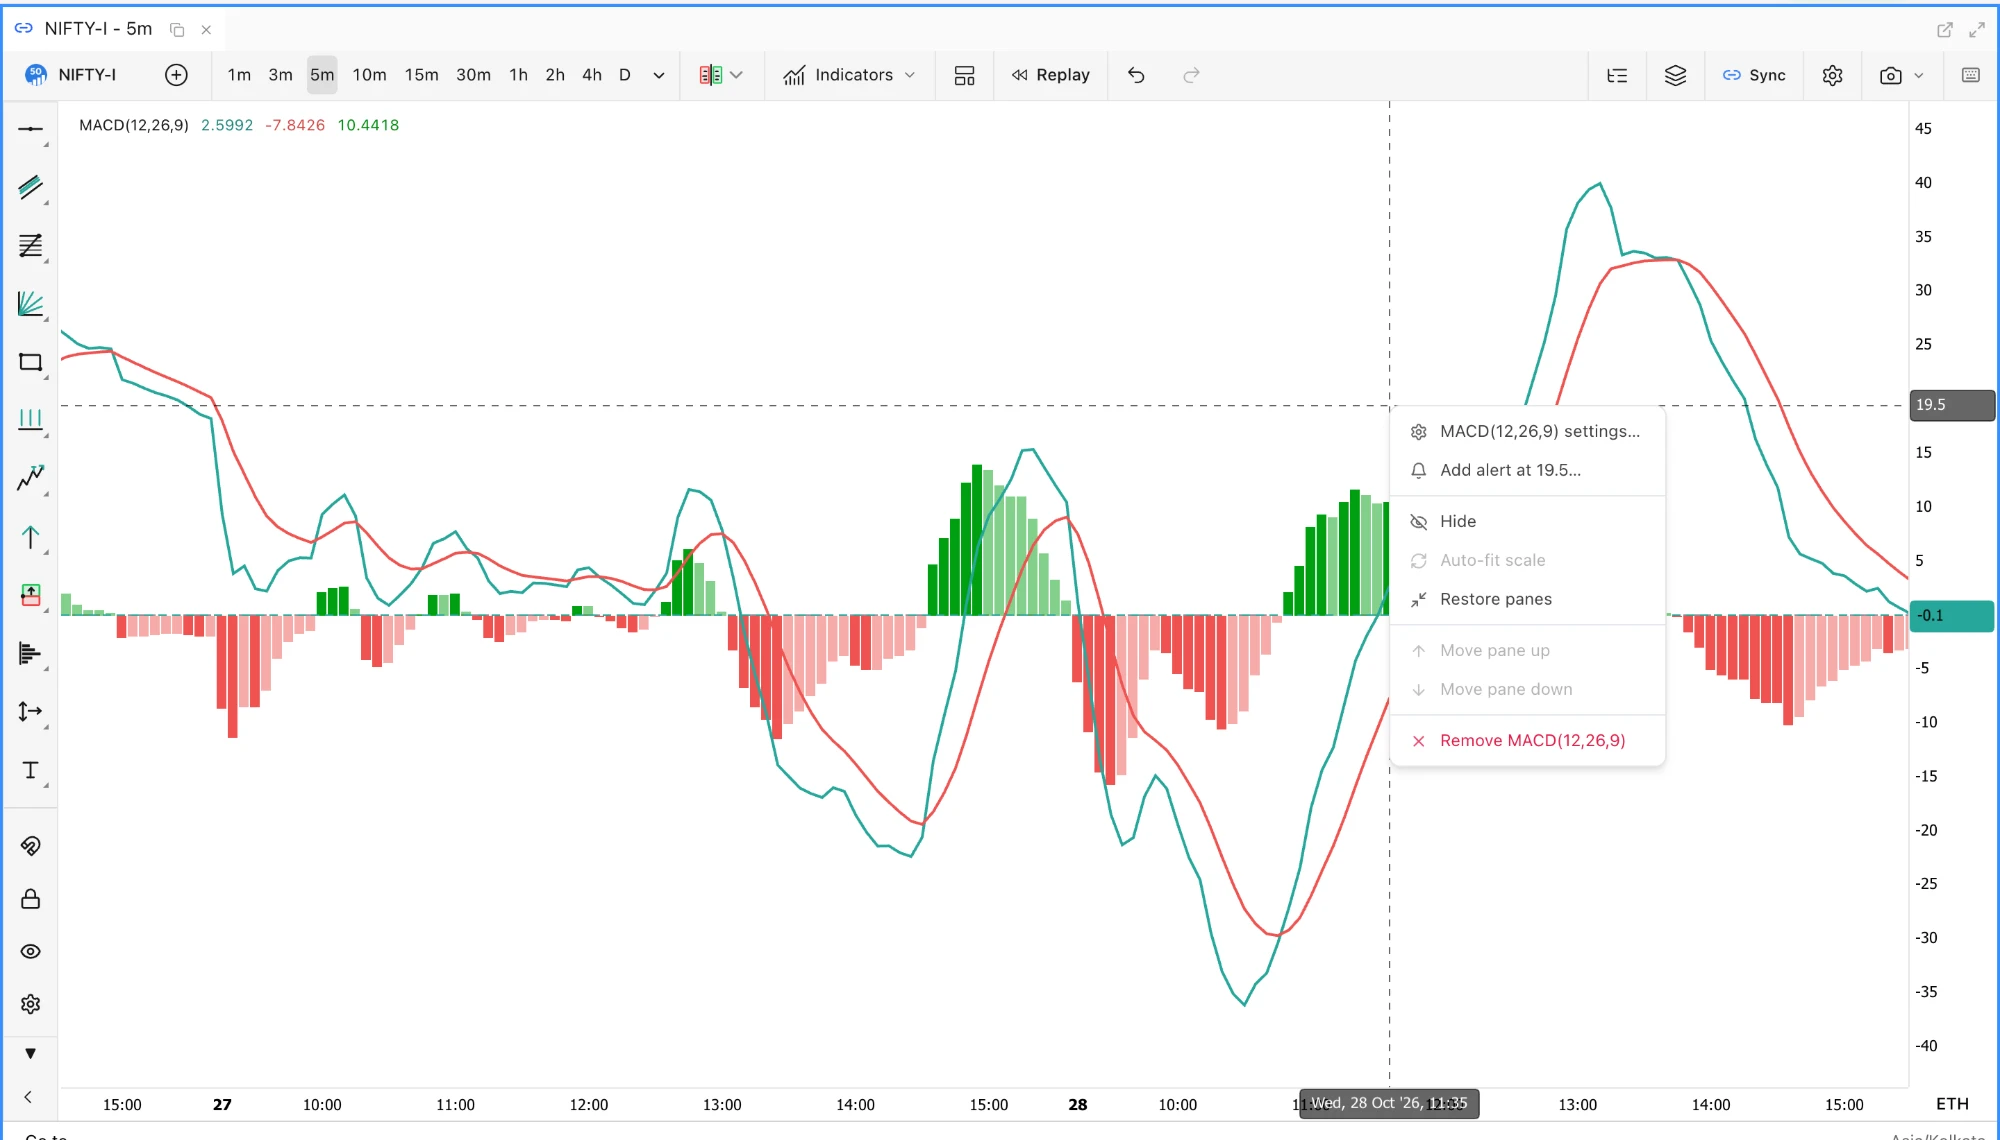
  • Pane headers and menu. Each pane's title row now looks and behaves like the price legend, with collapse, maximize and auto-fit buttons. Right-click a pane for its settings, an alert at the cursor level, hide, auto-fit, maximize, move up or down and remove; on touch screens a ⋯ button opens the same menu. Removing a pane shows an Undo button. A pane that cannot draw says why, for example "MACD needs 35 bars". CVD, OBV and IV can be drawn on the price chart's left axis.
  • Script data contract v2. Scripts can read open interest (oi.value, oi.change, oi.buildup and more), the bar's footprint (fp.poc, fp.vah, fp.val, imbalances and more) and flow.sessionCvd, from the same per-bar values as the Data Inspector and the CSV export. The Script Editor lists every field under Data reference (contract v2: flow, oi, fp). Script Editor guide.
  • Replay on phones. Tap a candle to start a replay there, or hold to aim first and tap Start here. The replay controls fit a phone screen in two rows, the timeline scrubs with a finger, and speed and step size use the same dropdowns as the rest of the terminal. Replay guide.
A NIFTY-I 5-minute chart with the MACD(12,26,9) pane maximised: the pane header in the price legend's style with its values, the histogram in four shades of green and red around zero, and the pane's right-click menu open with MACD(12,26,9) settings, Add alert at 19.5, Hide, Auto-fit scale, Restore panes, Move pane up, Move pane down and Remove MACD(12,26,9).
A maximised MACD pane with its right-click menu: settings, an alert at the cursor level, auto-fit, restore, move and remove.

Fixed

  • Indicator templates keep your chart. Loading an indicator template no longer replaces every drawing on every symbol, the chart settings, or the symbol and timeframe.
  • MACD and Volume periods. Periods typed in the add dialog for MACD and Volume are now applied; saved layouts with the old values still open.
  • Linked charts and panes. Hovering an indicator pane moves only the time on linked charts; it used to send the pane's value as a price. A study that fails while drawing no longer freezes the chart, IV and Greek panes leave gaps for missing data instead of drawing zeros, and idle charts no longer repaint every pane once a second.
  • Session End level lines. With Extend Until set to Session End, a profile's POC, value area, LVN and HVN lines ran through the whole next session whenever the profile closed with its session. They now stop at the close of the session the profile ends in.
  • Profiles synced from another chart. A Volume Profile or other study imported from a chart on a different symbol, through a workspace, a template or a linked chart, kept that chart's tick and bin size until the zoom or timeframe changed. It now takes the chart's own.
  • Cluster text keeps one size while zooming. Footprint cells could draw at two font sizes in the same candle and pass through fractional sizes while zooming; every row now shares one whole-pixel size.
  • Strategy `close(tag)` no longer closes another entry's units once its own entry has exited.
26.10.22Release

GEX Levels, the Institutional Flow panel, five volume profile styles with levels marked on the bars, and crisper clusters

A GEX Levels overlay draws the call and put walls, gamma flip, max pain and an expected range for the weekly and monthly expiries. A new Institutional Flow panel follows NSE FII and DII flows and participant-wise open interest. Volume profiles gain Solid, Hollow, Linear, Step and Combined styles and can mark their levels on the bars instead of drawing lines, and cluster cells line up their bid × ask text.

New

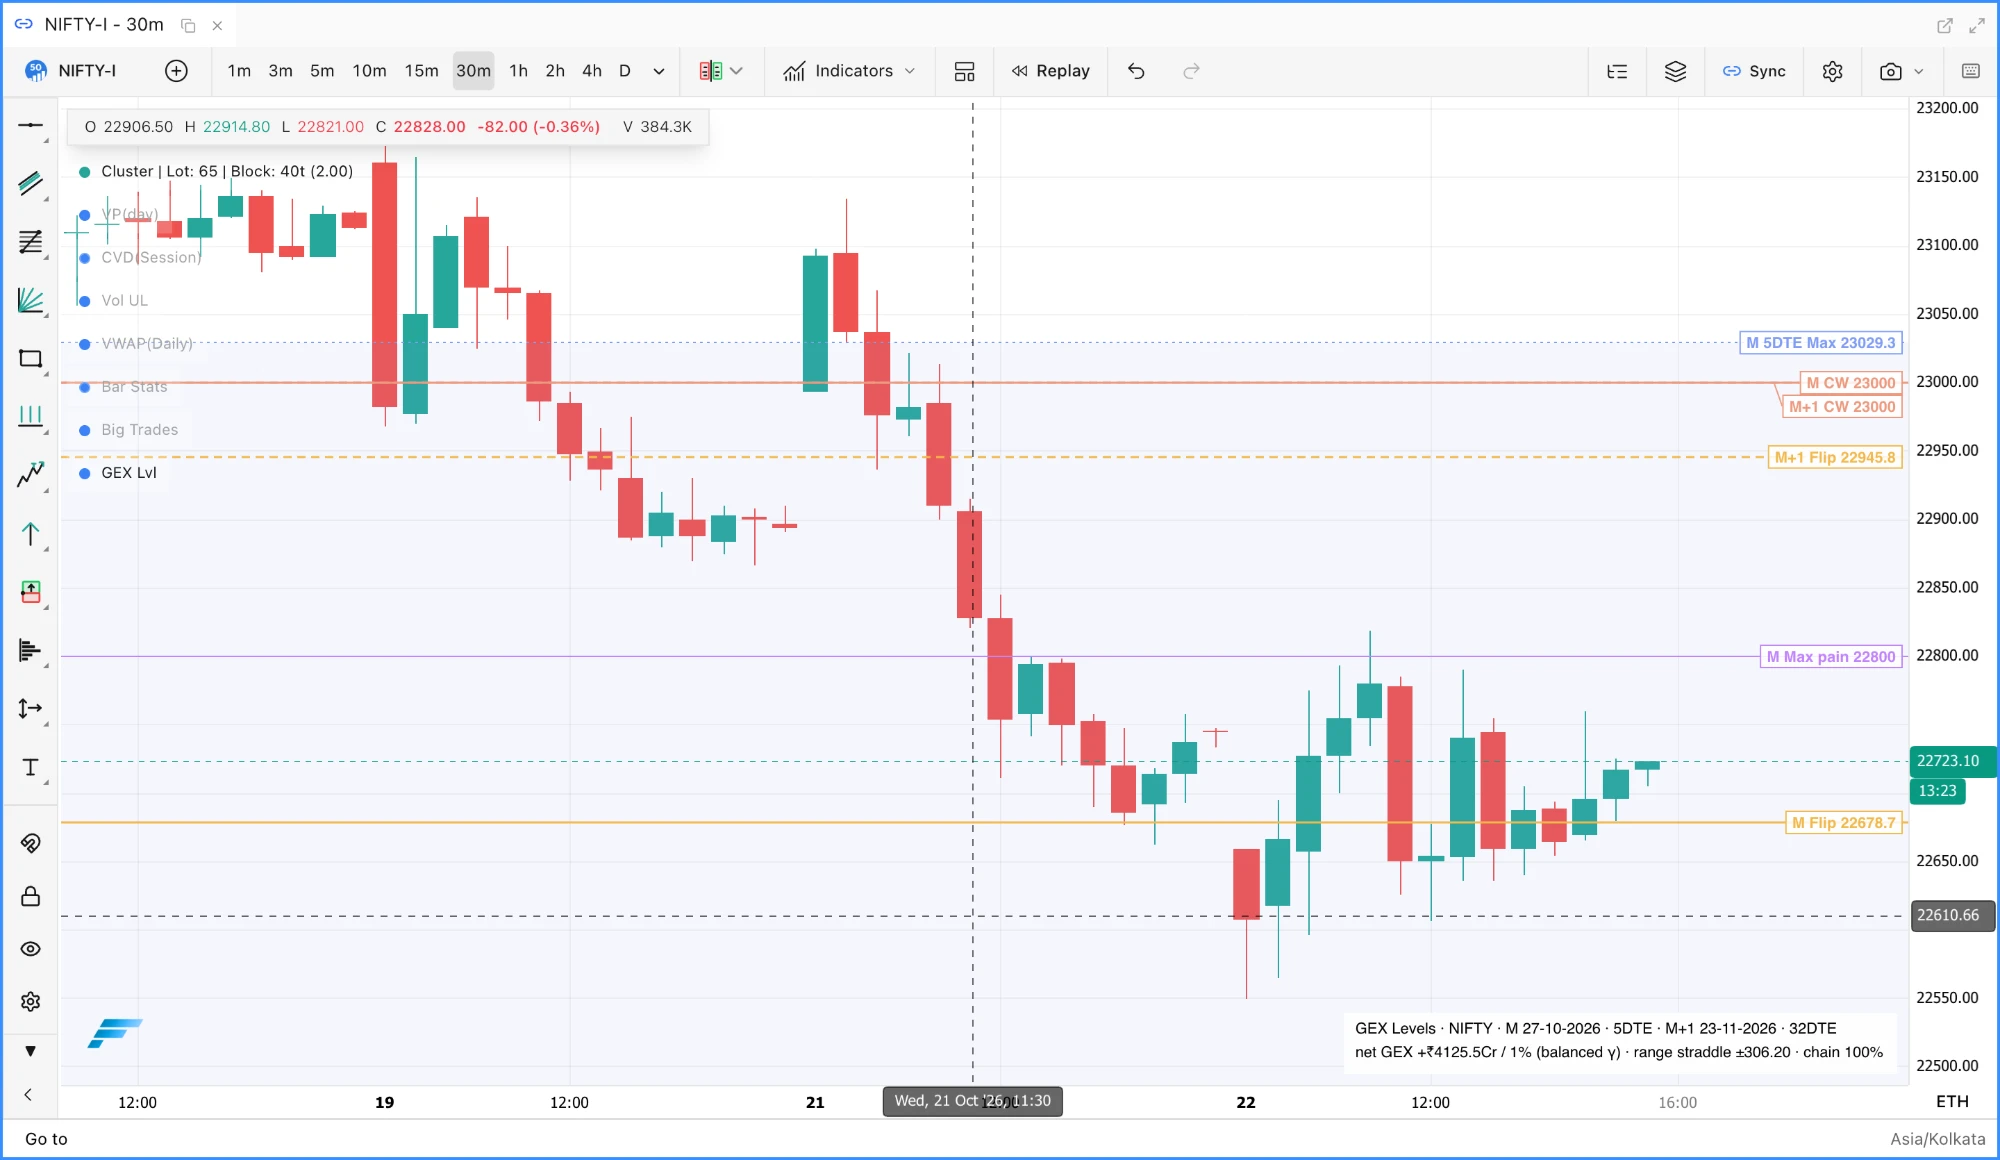
  • GEX Levels, under Indicators ▸ Volatility, draws dealer gamma levels on the chart for the nearest expiry (solid lines) and the monthly expiry (dashed): the Call wall and Put wall (the largest call open interest at or above spot and the largest put open interest at or below it), the Gamma flip where net dealer gamma crosses zero, Max pain, and an Expected range from the ATM straddle, from ATM implied volatility or from the latest India VIX close, labelled with the days to expiry. Gamma walls and the ATM strike are there too, off by default. Every level has its own switch per expiry, each expiry can be picked by hand, labels sit as chips at the right edge with a connector to the line, and an optional History trail replays the walls, flip and max pain per candle over the last one to five days. Levels are computed at the chart's latest candle from each contract's latest bar, accept a quote up to three candles old, and draw nothing when fewer than 60% of the chain has a usable quote. GEX Levels guide.
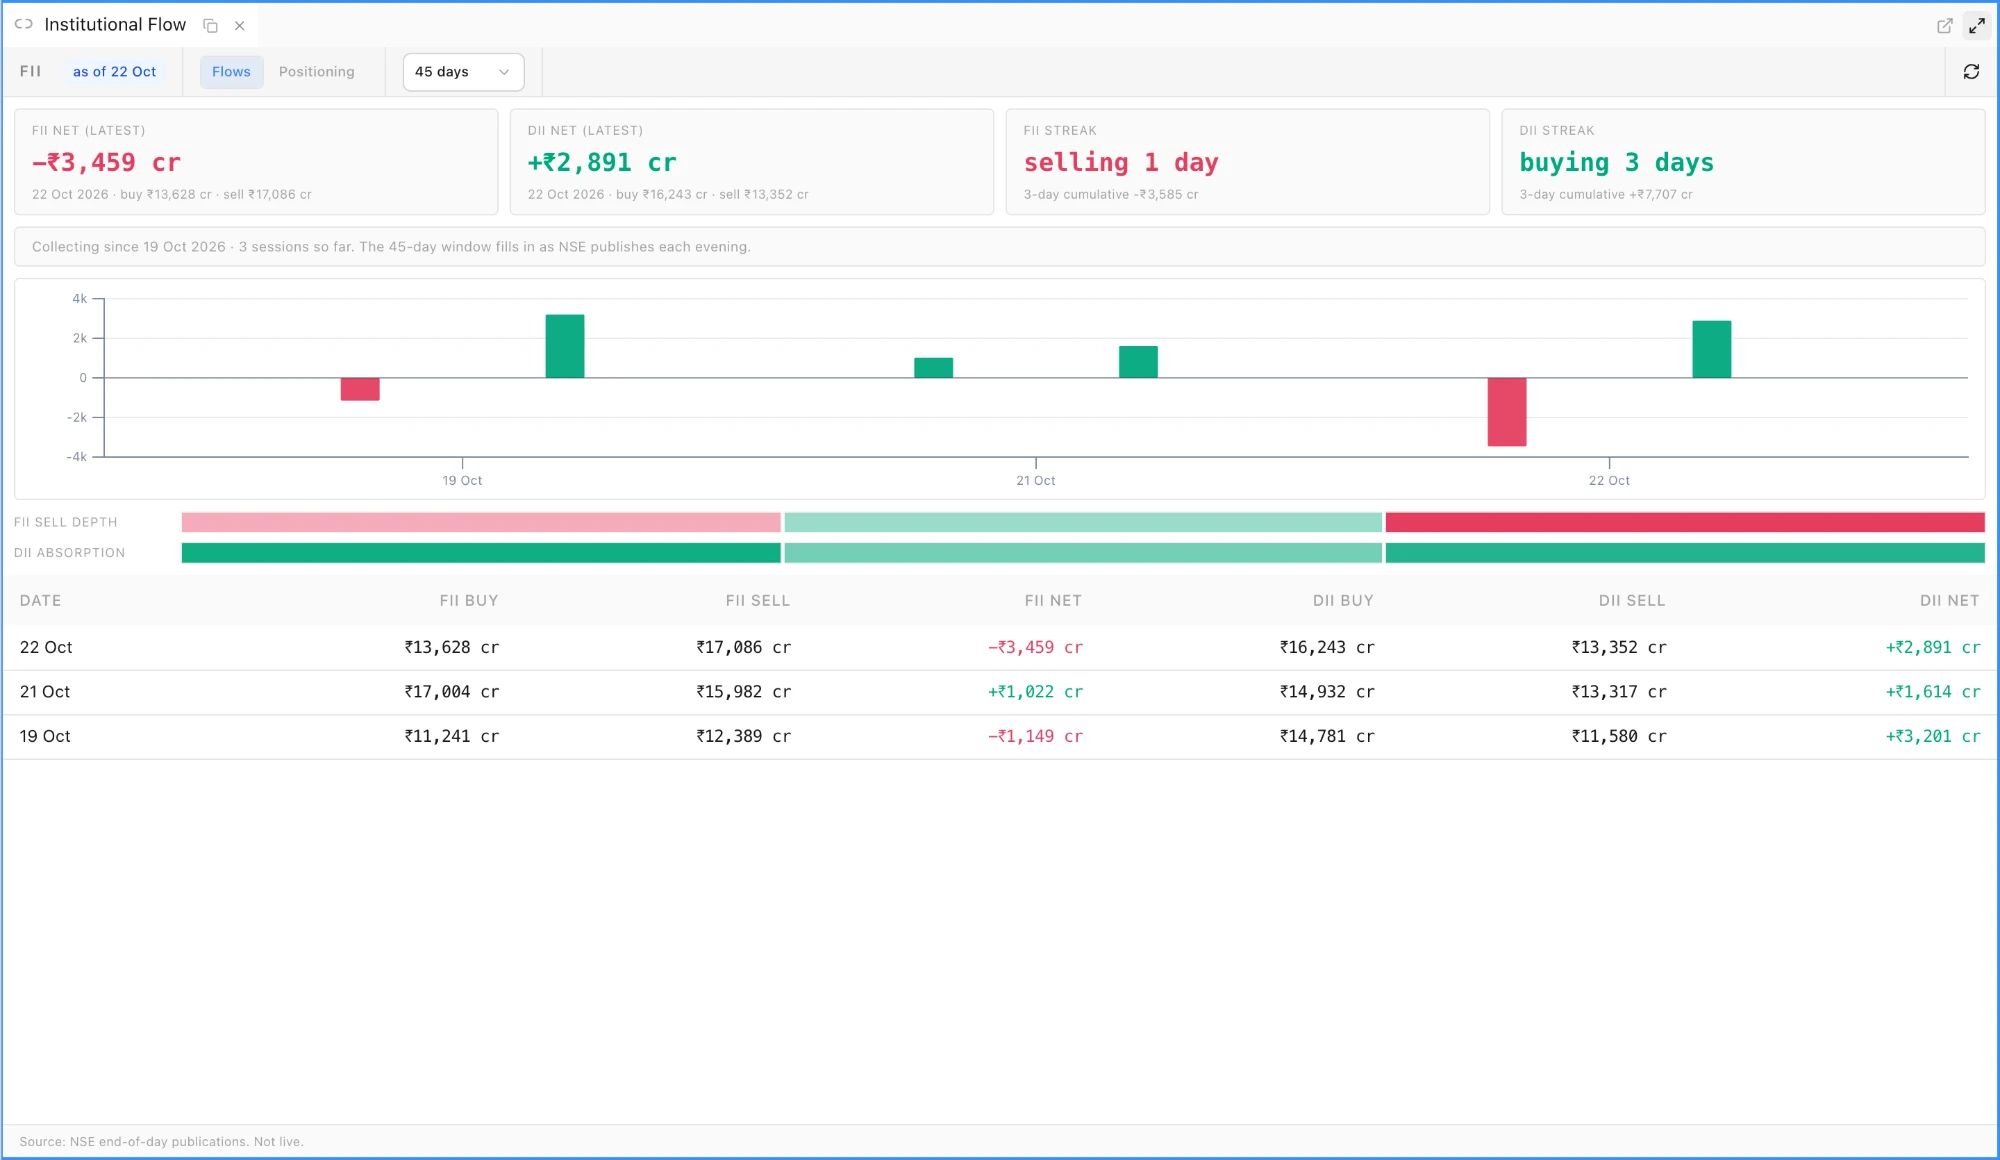
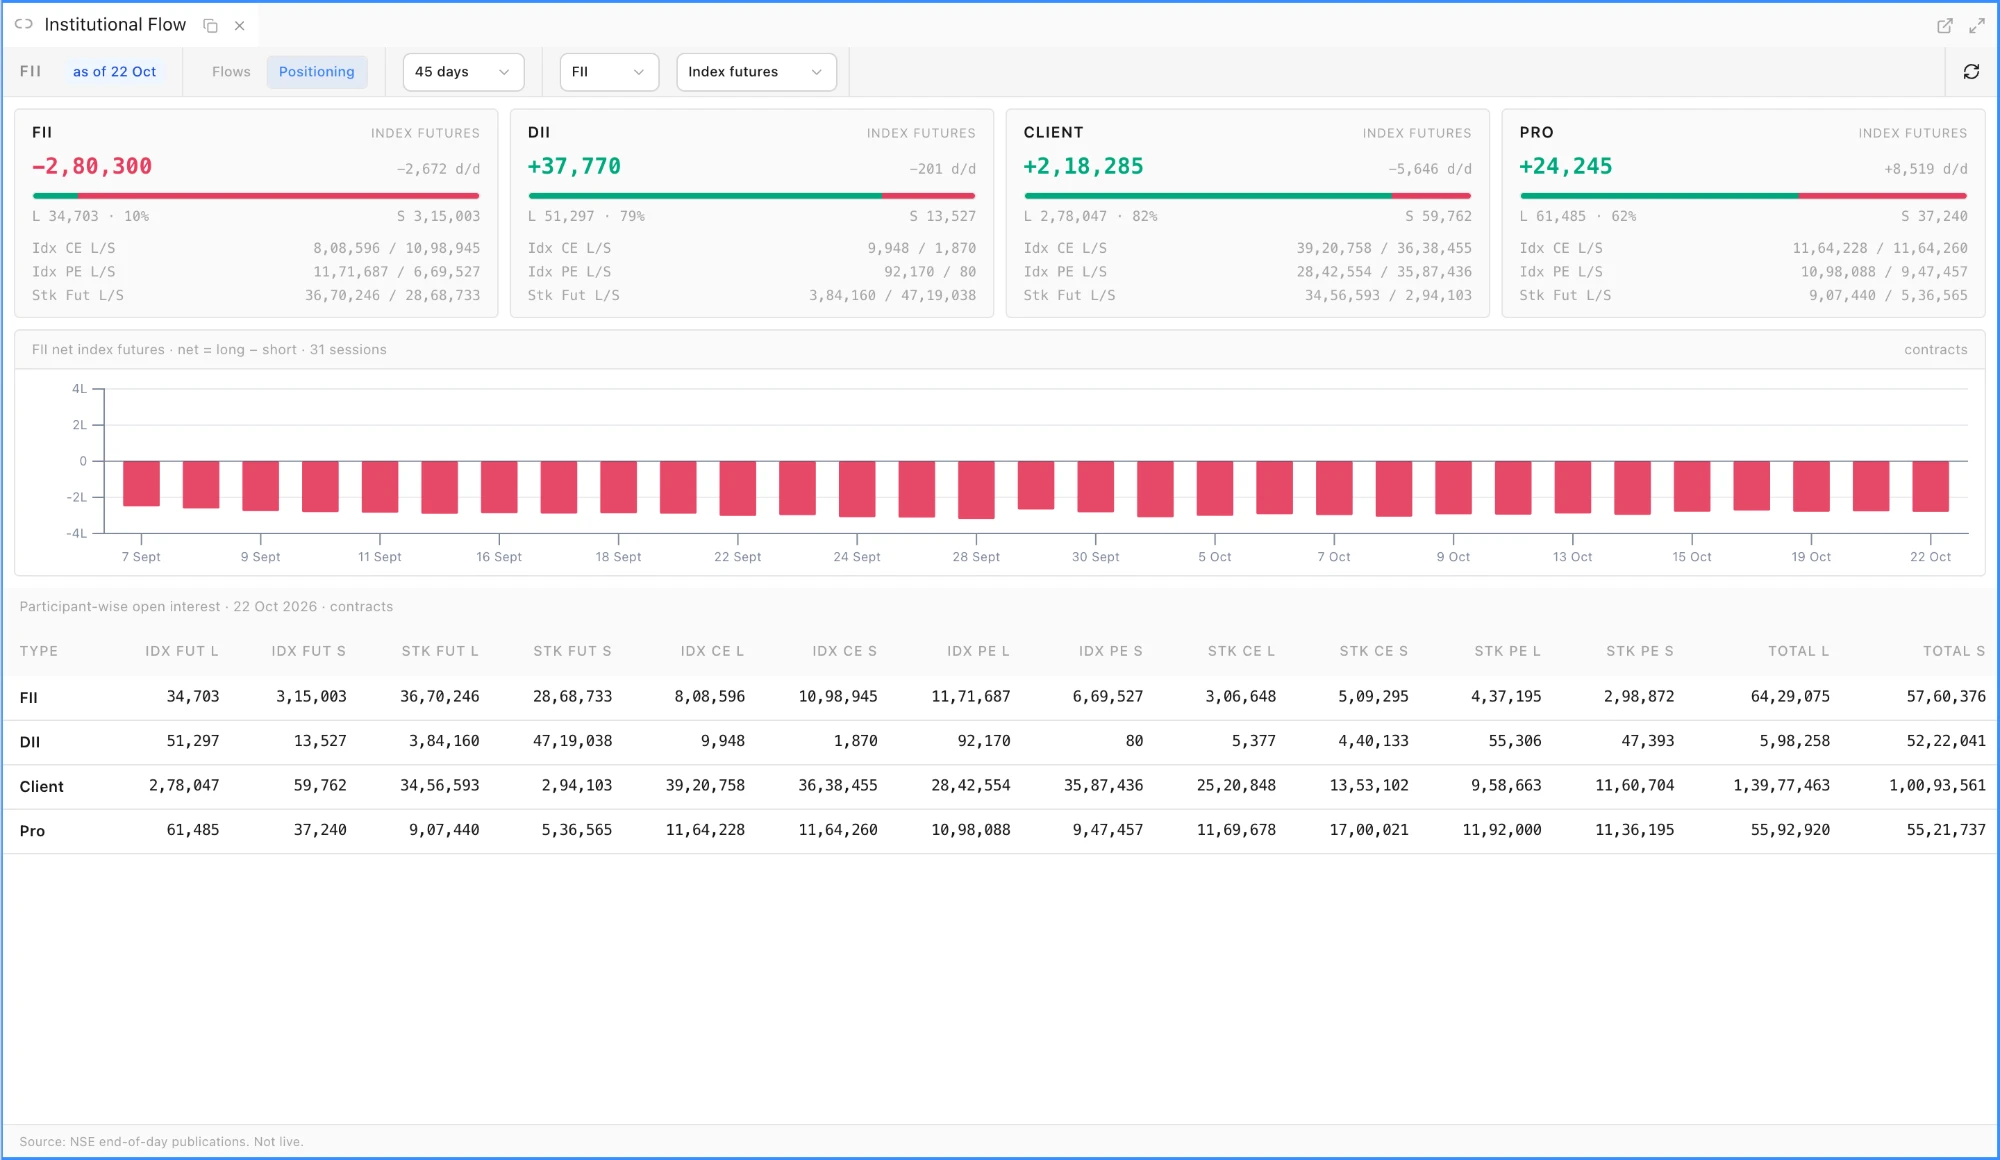
  • Institutional Flow panel, from Widgets, follows the NSE end-of-day institutional data. The Flows view shows the latest FII and DII net with their buy and sell totals, each side's buying or selling streak, the window total, a bar chart by day, two heat strips for FII selling depth and DII absorption, and a newest-first table. The Positioning view shows one card per client type (FII, DII, Client and Pro) with index futures long and short, the net and its change on the day, index call and put and stock futures positions, a net-position history chart for any client type and instrument group, and the raw participant-wise table. The window is 20, 45 or 90 days, and the view, window, client type and instrument are kept with the workspace. The data is public, so the panel is on every plan.
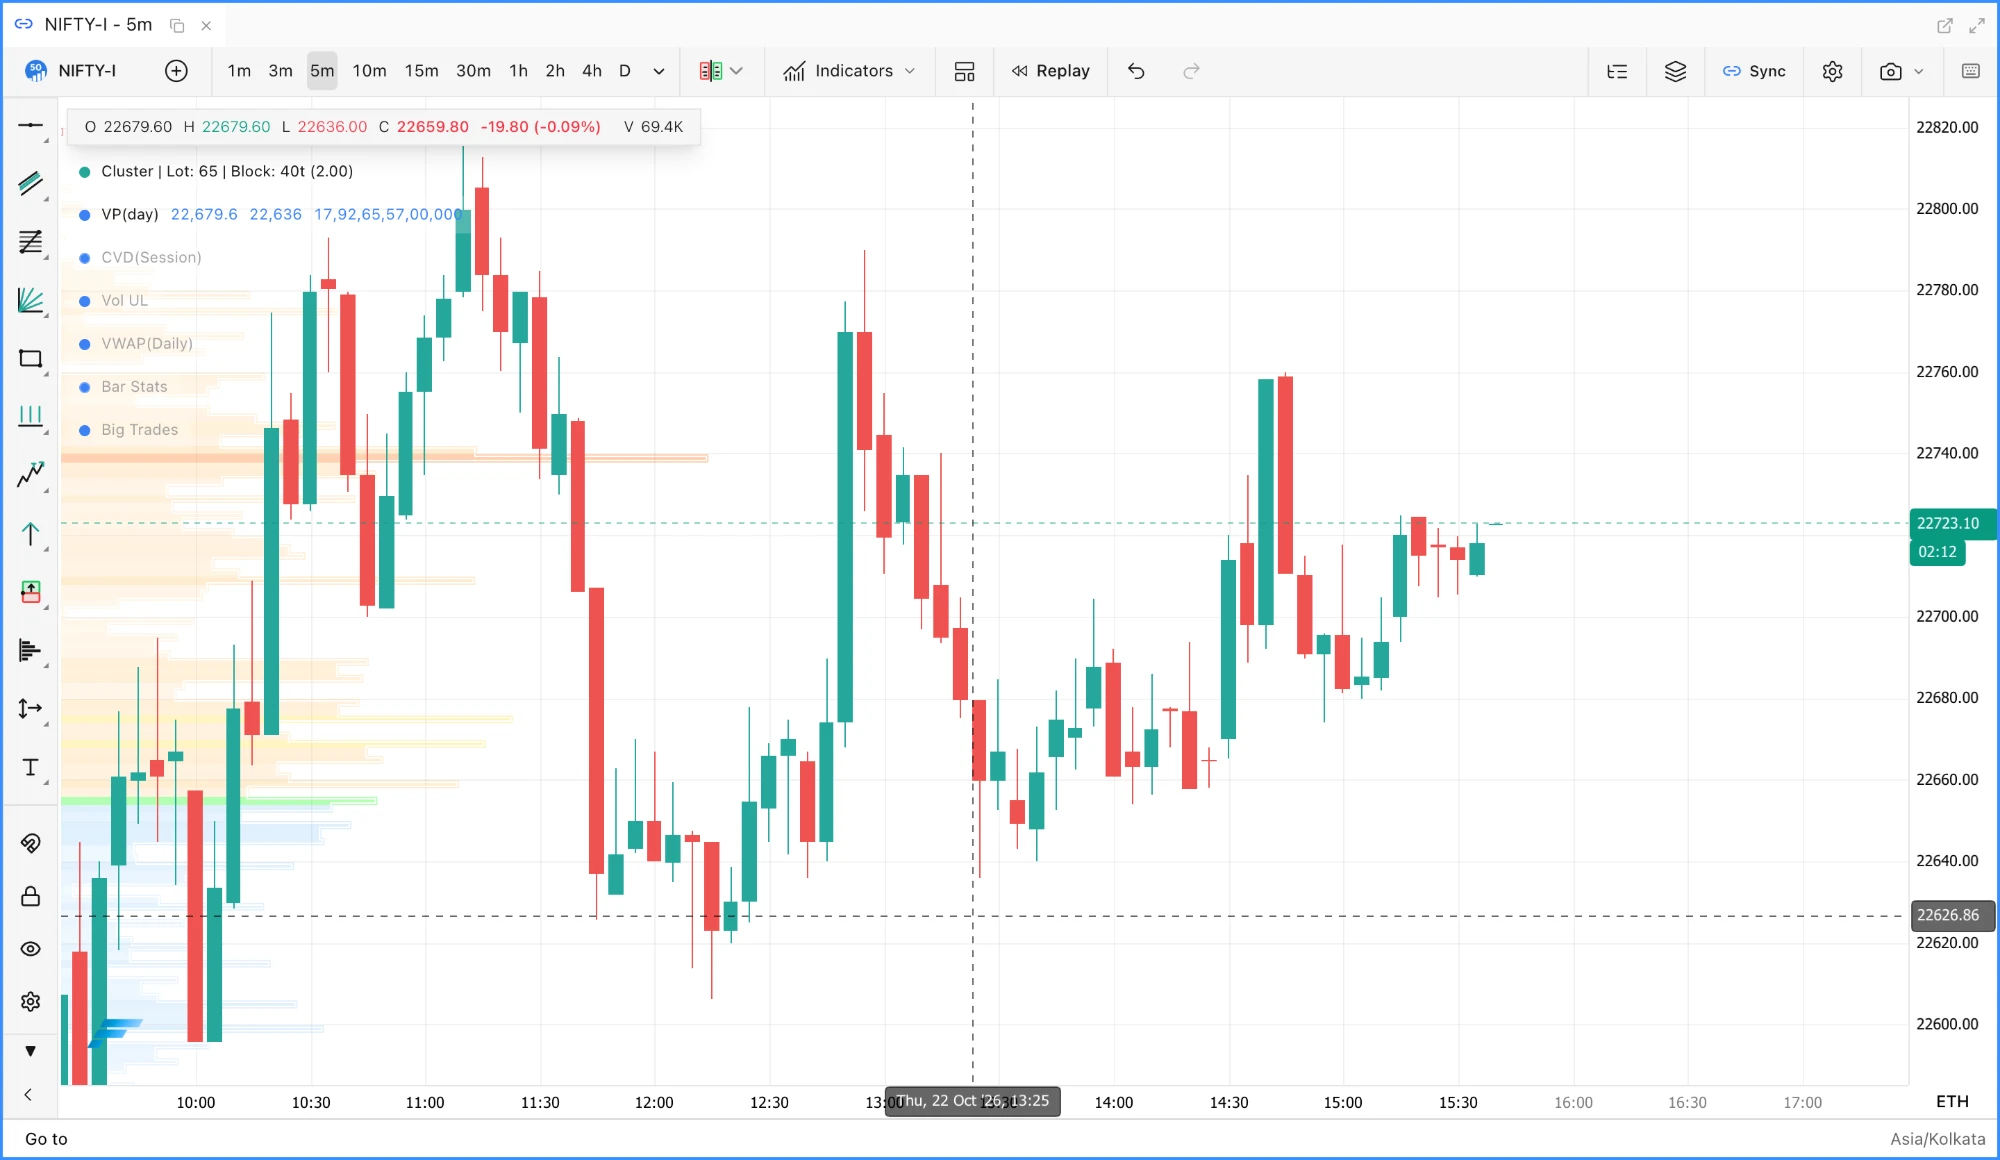
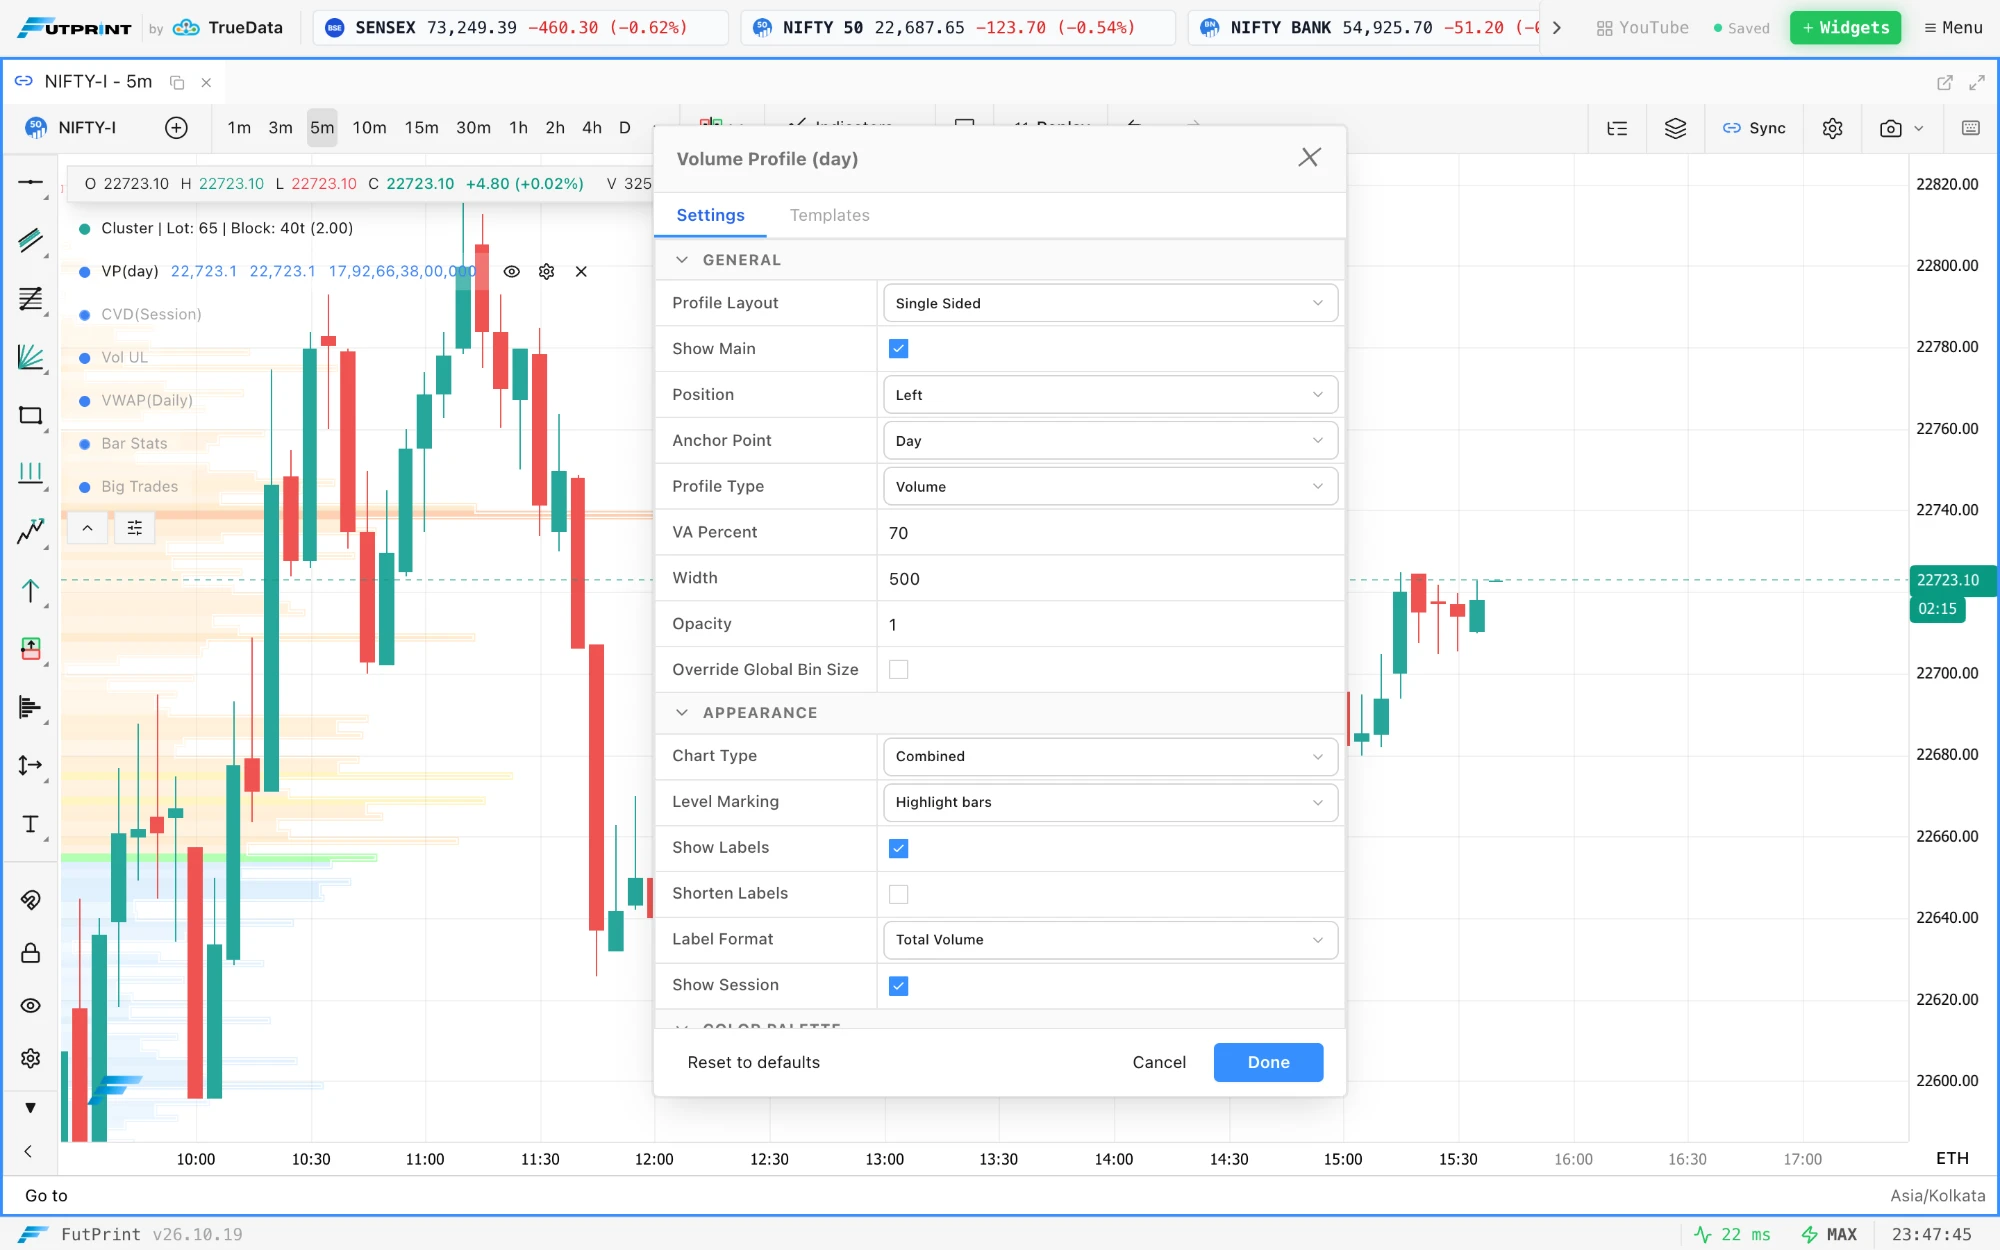
  • Volume profile styles. The Chart Type of a volume profile is now Solid, Hollow, Linear, Step or Combined: solid bars with a one-pixel gap between rows, the outline of each bar, a line or a stepped line through the bar ends, or solid bars with a stepped outline. The stepped profile, the fixed range volume profile drawing and the TPO chart's side histogram share the same styles. Volume Profile guide.
  • Level Marking. A volume profile can show its POC, value area, LVN and HVN levels as Lines across the chart, as Highlight bars that paint the bar at each level in that level's colour on the profile itself, or as both. Each level's own Show switch still decides whether it is marked, each side of a two sided profile has its own setting, and the composite profile has its own.
  • The composite profile has every option a period profile has. Besides Level Marking, the composite gains its own Chart Type, Opacity, Text Color and Highlight Conditions.
A NIFTY futures 30-minute chart with GEX Levels on it: a solid orange call wall at 23000 for the 27 October expiry with the monthly call wall on the same strike, a dashed monthly gamma flip at 22945.8, a solid flip at 22678.7, a purple max pain line at 22800, a shaded expected range up to 23029.3 labelled M 5DTE Max, chips at the right edge naming each level, and a legend at the bottom right reading GEX Levels, NIFTY, M 27-10-2026 5DTE, M+1 23-11-2026 32DTE, net GEX plus 4125.5 crore per 1% (balanced gamma), range straddle plus or minus 306.20, chain 100%.
GEX Levels on NIFTY futures: walls, flip, max pain and the expected range for the nearest and monthly expiries, with the legend at the bottom right.
The Institutional Flow panel on its Flows view over a 45-day window: cards for FII net minus 3,459 crore and DII net plus 2,891 crore on 22 October with buy and sell totals, FII selling 1 day and DII buying 3 days, a notice that collection started on 19 October, a bar chart of the three sessions, FII sell depth and DII absorption strips, and a table of the three days with FII buy, sell and net and DII buy, sell and net.
The Institutional Flow panel's Flows view on the first three sessions it has collected.
A NIFTY futures 5-minute chart with the day's volume profile at the left in the Combined style, each row a solid bar with a stepped outline, and its levels marked on the bars: the POC row in orange, the value area high in yellow, the value area low in green, HVN rows in gold and LVN rows in grey, with no level lines across the chart.
A day profile in the Combined style with Level Marking set to Highlight bars: the POC, value area, HVN and LVN rows take their colours on the profile and no lines cross the chart.
The Institutional Flow panel on its Positioning view: cards for FII, DII, Client and Pro with their index futures long and short contracts, net and change on the day, index call and put and stock futures positions; a 31-session bar chart of FII net index futures; and the participant-wise open interest table for 22 October 2026.
The Positioning view: one card per client type, the net-position history and the participant-wise open interest table.

Improved

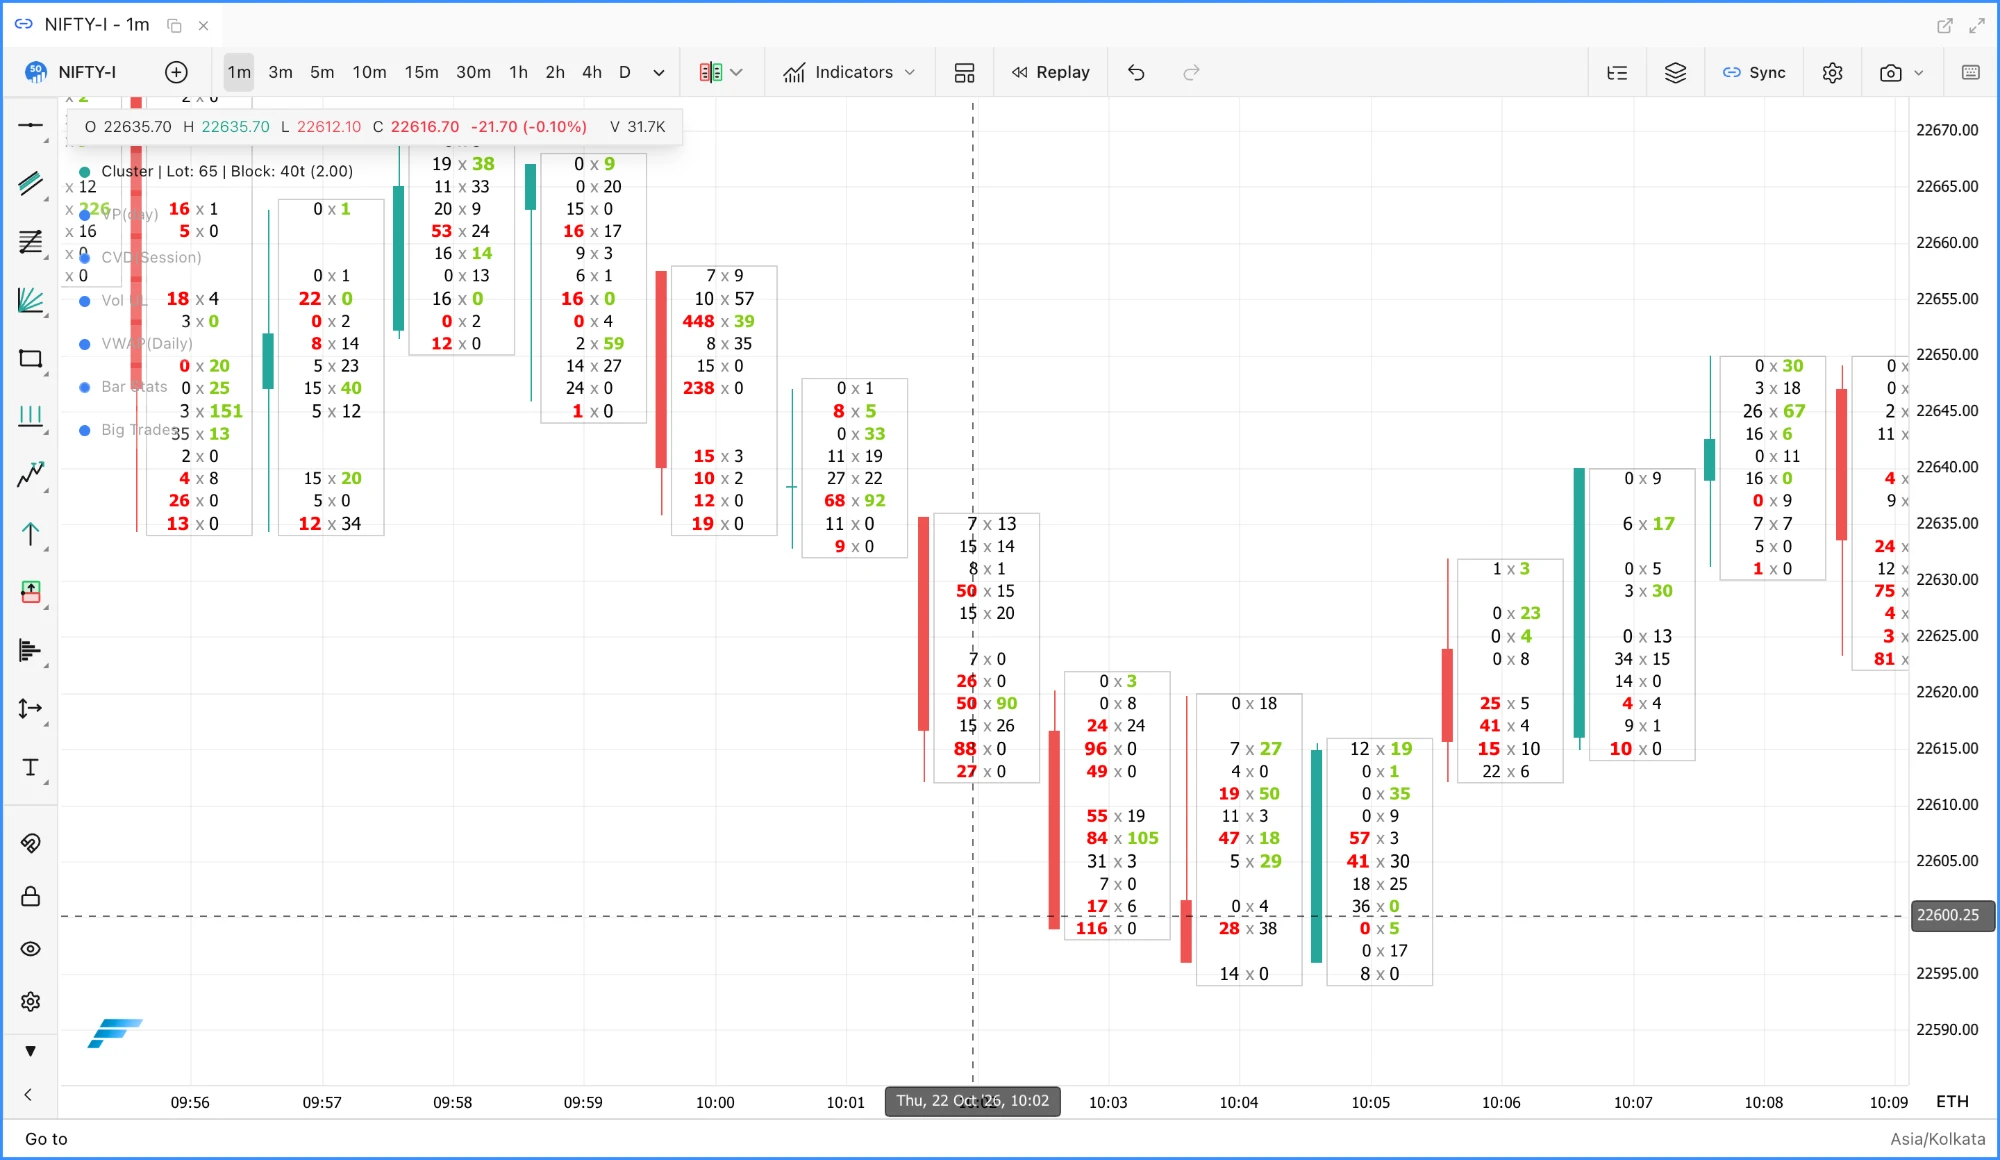
  • Cluster bid × ask text lines up. With Bid-Ask Volume or Bid-Ask Delta Volume as the volume type, the x between the two numbers sits on the centre line of every cell, the bid ends just left of it and the ask starts just right of it, so the column of x's is straight whatever the digit counts. The x is a mid grey that reads on both themes.
  • Slim clusters are framed. With the Slim candle style, each cluster's cells get a light one-pixel frame from its highest to its lowest price level, on each side of the candle's slot, so the cluster reads as one block beside its candle.
  • Settings preview as you change them. A change in the chart settings dialog, such as a cluster colour or volume type, now repaints the chart at once rather than on the next pan, click or Done.
  • Numbers stay readable on emphasised rows. On a Bid-Ask Delta Volume row painted with a strong gradient, the bid, the x and the ask each pick black or white against what is actually painted under them, so no number disappears into the bar.
  • GEX legend. The GEX Levels and Options GEX Heatmap summary box sits at the bottom right of the plot, a Legend position setting moves it to any corner, and Show legend and data status hides it entirely.
A NIFTY futures 1-minute cluster chart with Bid-Ask Volume cells: in every cluster the bid is right-aligned to the left of a grey x and the ask left-aligned to the right of it, so the x's form a straight column, and each cluster's cells sit inside a light frame beside its slim candle.
Bid × Ask cells with the x centred in every row and a light frame around each cluster's cells.
The Volume Profile (day) settings dialog open over the chart with Chart Type set to Combined and Level Marking set to Highlight bars, while the profile behind the dialog already shows the combined style and the coloured level rows.
The Chart Type and Level Marking settings, previewed on the chart behind the dialog as they are picked.

Fixed

  • MCX quantities are lots. The feed reports NSE and BSE quantities in units and MCX quantities in lots, but every lots derivation divided by the contract lot size, so a three-lot CRUDEOIL print read as 0.03 lots and Format Volume split MCX cluster volumes into fractions. Big Trades, Format Volume and the footprint lot size now treat MCX quantities as lots, and whole-lot labels drop the ".0".
  • GEX on MCX. The Options GEX Heatmap and GEX Levels asked for option chains on NSE and BSE only, so a CRUDEOIL chart reported no expiries. Both now read the MCX chain for an MCX chart, with the 23:30 cutoff an MCX expiry day keeps.
  • Profile rows at any zoom. Every volume profile bar is drawn over exactly the pixels its price span maps to. A minimum bar height in the composite and an offset in the period profile painted rows over their neighbours once the price axis was zoomed out, and the per-bar border is gone.
26.10.19Major release

Alerts on any indicator or script that fire with the terminal closed, the Options GEX Heatmap, and one-click updates

Alerts can now watch any study on your chart or an applied script, evaluated on the server so they fire while the terminal is closed, from one Create alert dialog. A new Options GEX Heatmap draws dealer gamma exposure by strike behind the candles and other improvements.

New

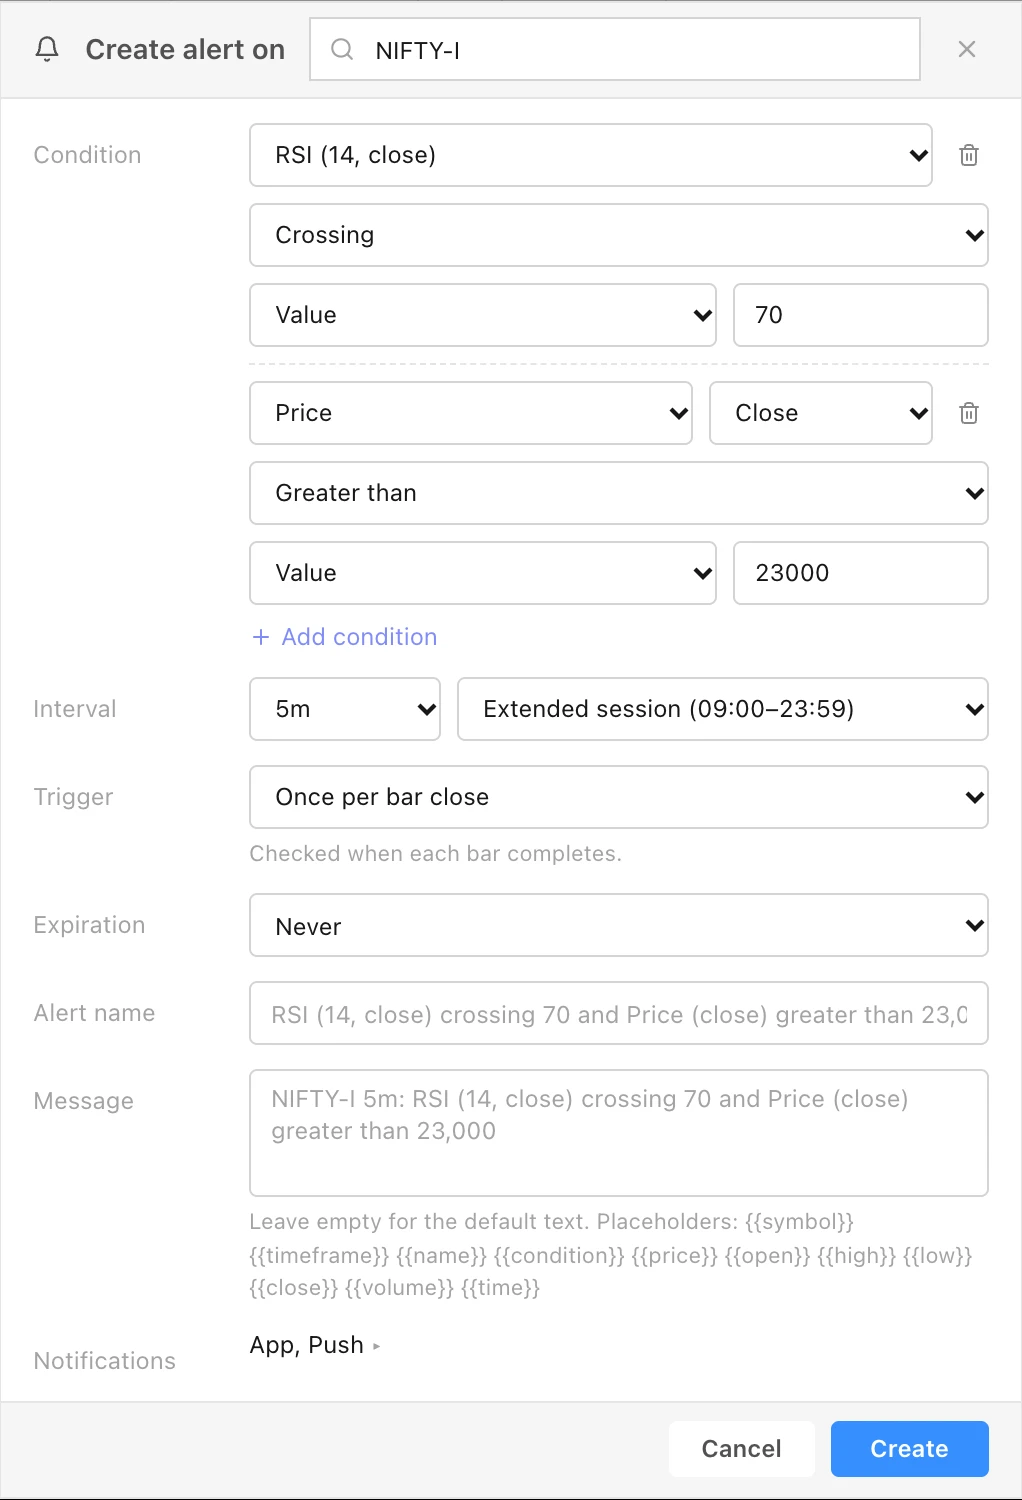
  • Alerts on indicators and scripts, evaluated on the server. One Create alert on … dialog builds the condition from left to right: a source (Price, Volume, or a study on this chart with its settings), its series or price field, the comparison (Crossing, Crossing up, Crossing down, and under More: Greater than, Less than, Entering, Exiting, Inside or Outside channel, Moving up or down by an amount or percentage within a number of bars), and what it is compared with: a value, a price field, another series of the same study, or another study on the chart. Add condition combines up to five. Set the Interval and session, the Trigger (Only once, Once per bar, Once per bar close, Once per minute), an Expiration, an Alert name, a Message with placeholders such as {{symbol}} and {{close}}, and the notification channels. The server evaluates these alerts, so they fire with the terminal closed. Open the dialog from the chart's right-click menu (Create Alert…), from Create alert in a study's settings, which preselects that study, or from the Alerts panel's +. See the Alerts guide.
  • Script alerts. Choose an applied script, then one of its alert() declarations or all of them. Alert messages are read at the bar that fired, and a positional mode on req.timeframe and req.symbol is honoured instead of silently running confirmed.
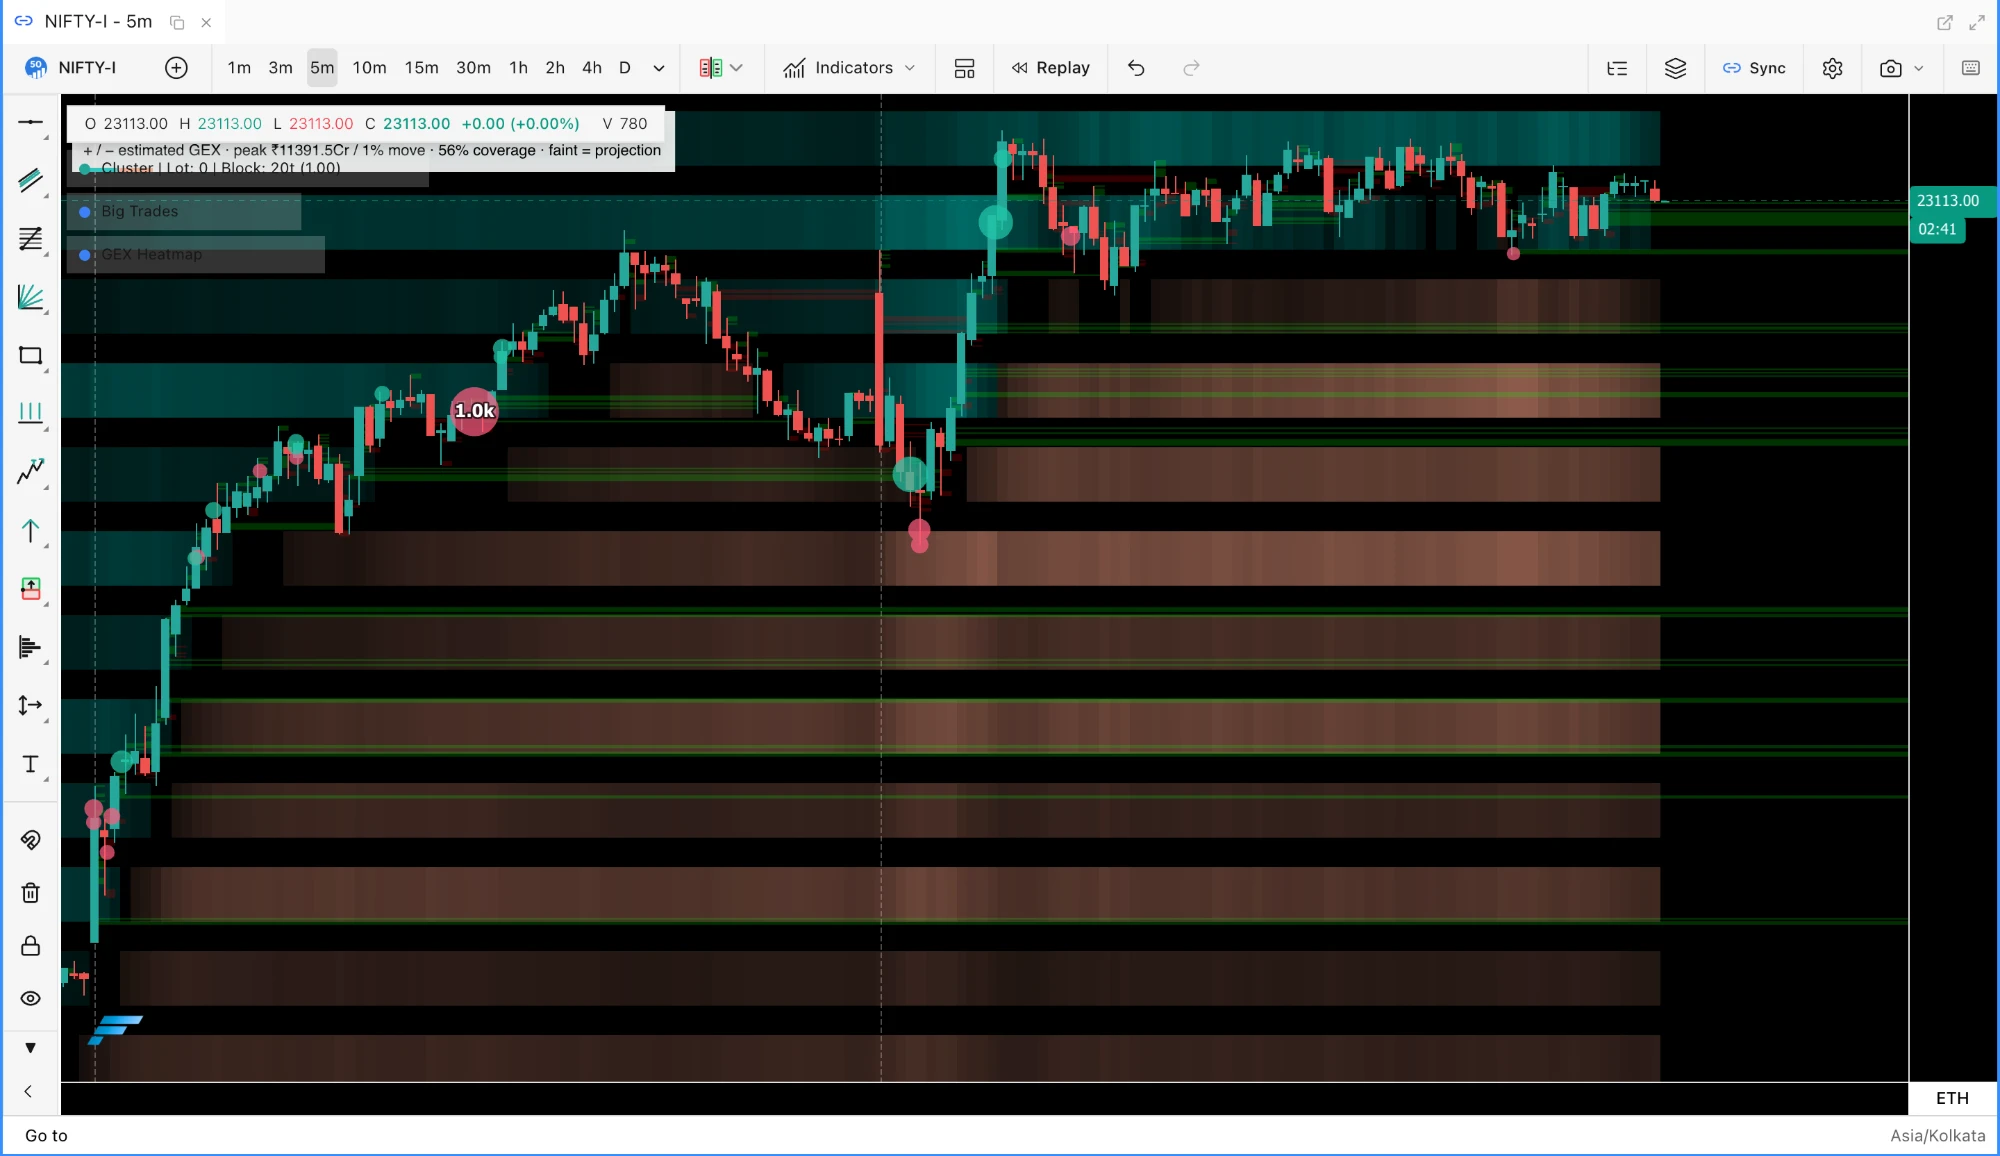
  • Options GEX Heatmap, under Indicators ▸ Volatility, draws signed, magnitude-weighted bands of dealer gamma exposure by strike behind the price candles, built from option close and open-interest history for the chart's underlying, with a faint extension marking the latest column's projection. Hover a band for the strike, expiry, candle time, the call and put contributions and chain coverage. Exposure refreshes once the chart advances to a new candle, and raw option bars are kept on this device for 16 days so a reopened chart does not download them again. See the Options GEX Heatmap guide.
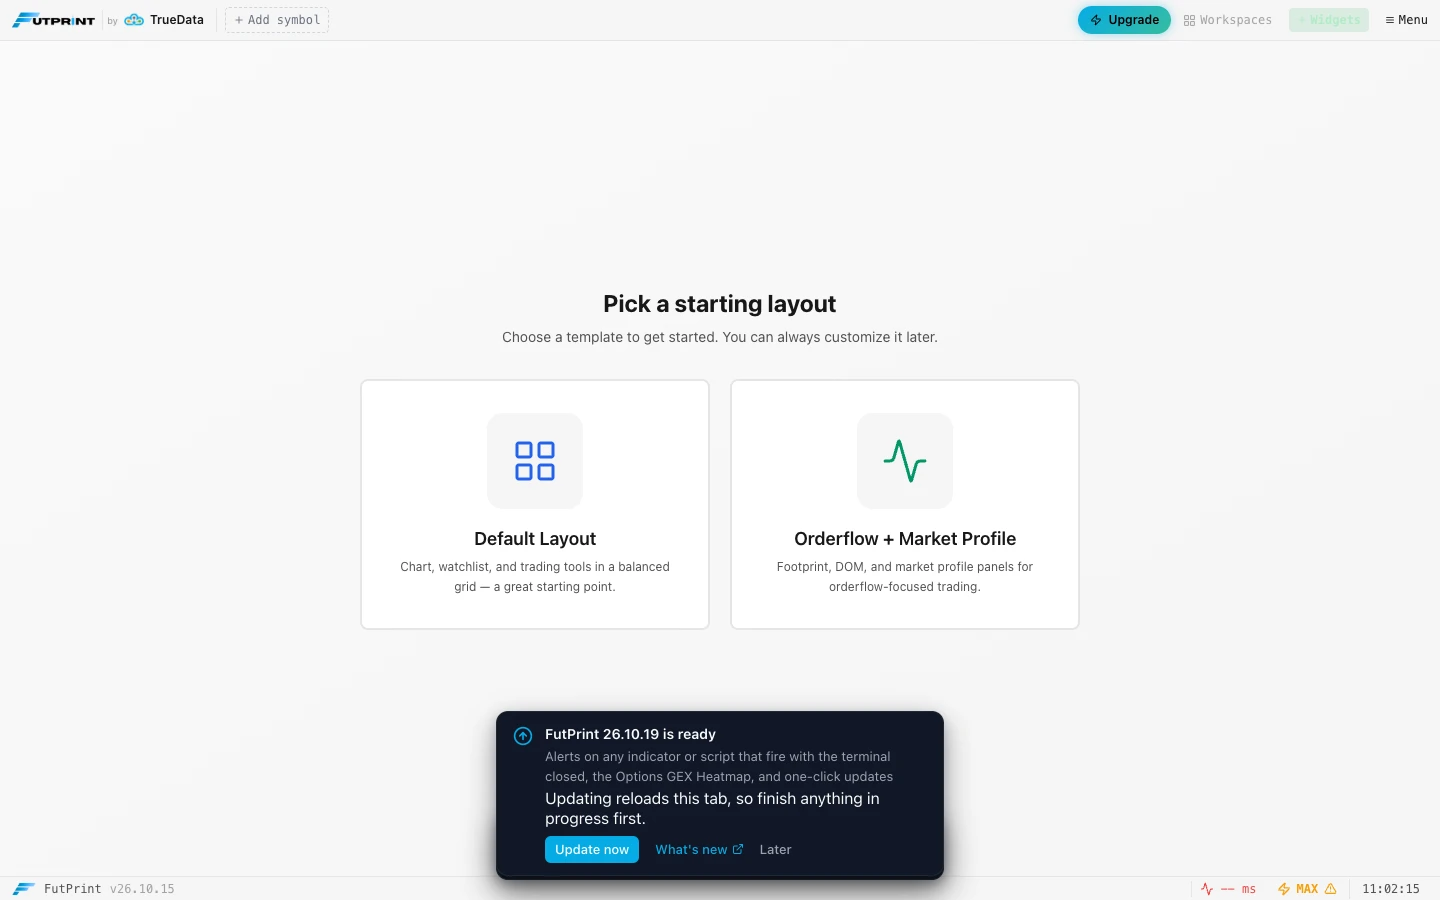
  • Release notice in the terminal. An open terminal learns within five minutes that a newer build is live and shows "FutPrint 26.10.19 is ready" at the bottom of the workspace, with the release title, Update now, What's new and Later. Update now switches in place: the tab reloads under the new build with your workspace intact, and there is no need to clear site data. Later leaves an "Update to v…" pill in the footer, the profile menu gains a What's new row, and after the switch a toast says which version you are on. The desktop app shows the notice with a link to the notes, since its files ship with the installer.
The Create alert on NIFTY-I dialog over a chart, with two conditions: RSI (14, close) crossing 70, and Price (Close) greater than 23000; Interval 5m, Extended session; Trigger Once per bar close; Expiration Never; the default alert name and message; notifications App and Push.
The Create alert dialog on a NIFTY futures chart: a source, its series, the comparison and the operand per condition, with up to five conditions, then the interval, trigger, expiration, name and message.
A NIFTY futures 5-minute cluster chart with the Options GEX Heatmap behind it: teal bands where dealer gamma exposure is positive and salmon bands where it is negative, one per strike, darker where the exposure is larger, and the legend "estimated GEX, peak 11391.5Cr per 1% move, 56% coverage, faint = projection".
Options GEX Heatmap on NIFTY futures: positive and negative dealer gamma exposure by strike, per candle, with the faint projection of the latest column at the right edge.
The workspace with the release notice card at the bottom: "FutPrint 26.10.19 is ready", the release title, and the buttons Update now, What's new and Later.
The release notice an open terminal shows when a newer build is live; Update now switches the tab in place.

Improved

  • Alerts panel shows each alert's kind, rule, last message, engine errors and an Expired state, and the trigger dialog shows the engine's message. Chart lines are drawn for price alerts only, and a plain "Price crossing up or down a value" stays a tick-level price alert with its line.

Fixed

  • A deploy no longer breaks open tabs. The old update path replaced the cache under open tabs, so the page failed on its next panel load until site data was cleared. New builds now wait for the release notice, and accepting it reloads every open FutPrint tab under the new build.
  • Alert dialog: the alert socket subscription is released when the dialog closes, editing an alert keeps its in-app notification, and the trigger frequency can be changed.
26.10.17Release

Indicator templates and defaults, TPO level lines clear of the period candle, and a setup notice for new accounts

Every indicator gains a Templates tab that keeps named settings in your account and one default per indicator, in the settings dialog and in the Indicators browser. The TPO chart draws its level lines after the period candle and on the row edges, Big Trades marks a restored chart straight away, a composite profile loads the days it needs, and new customers see their account being set up instead of a blank plan.

New

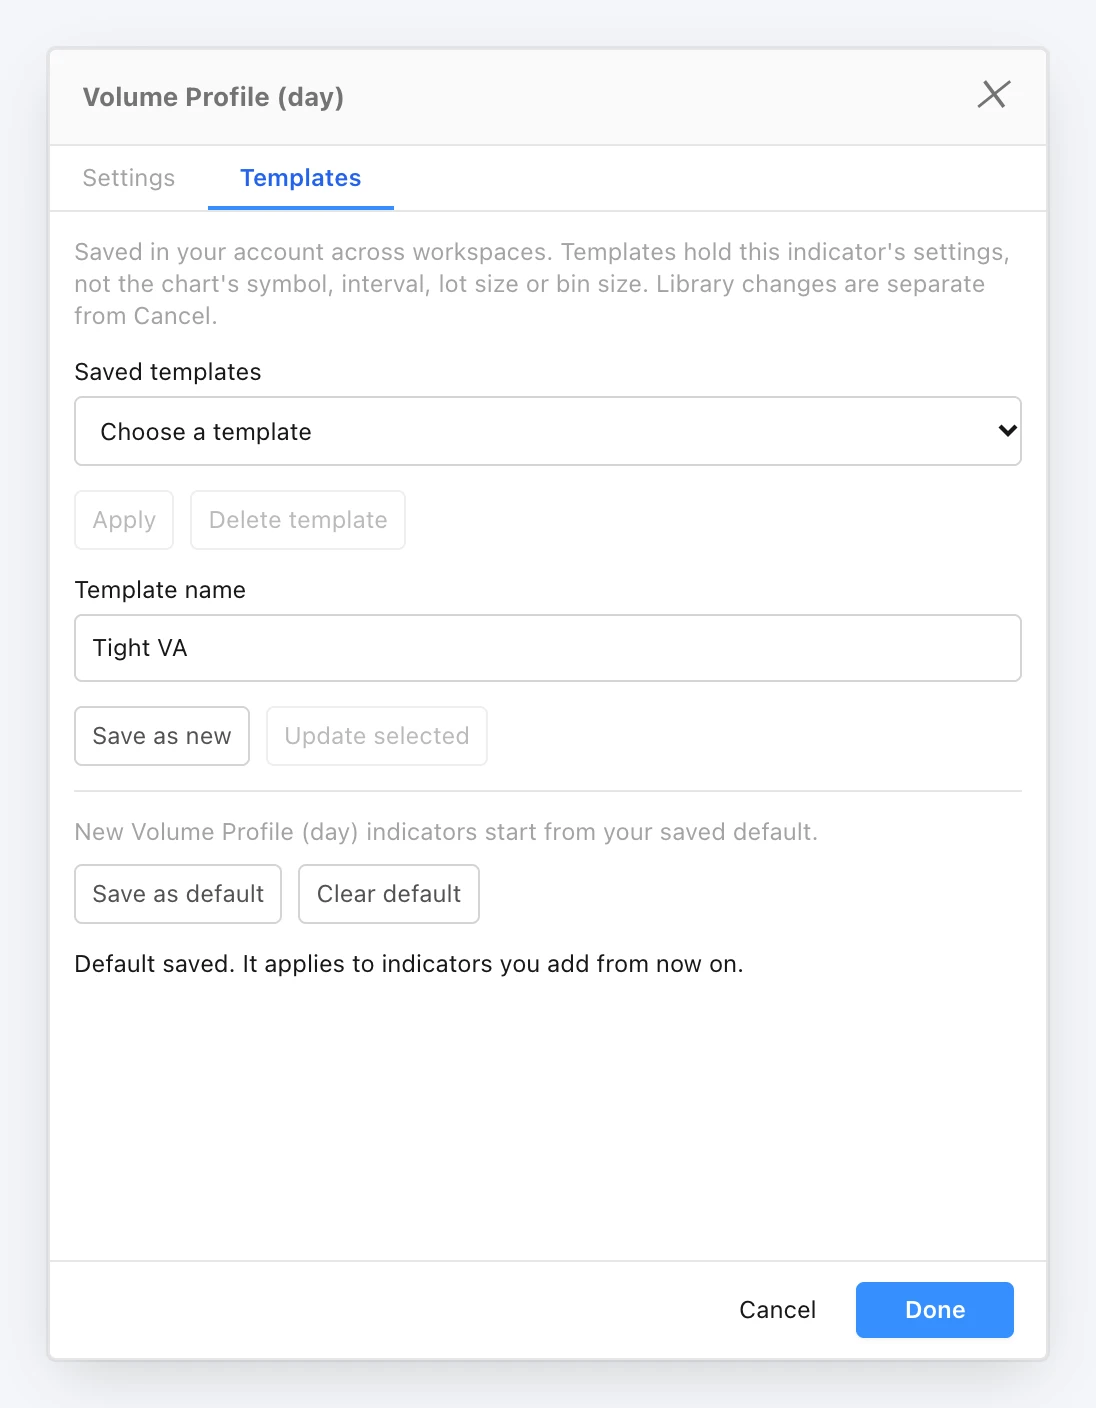
  • Indicator templates: a Templates tab in every indicator's settings dialog and in the Indicators browser keeps named sets of that indicator's settings in your account, as drawing tools already do, so a Volume Profile or CVD set up the way you like it can be applied on any chart in any workspace. Apply puts a saved template onto the indicator you are editing and Cancel still restores the settings you started from; Save as new, Update selected and Delete template maintain the list. Templates hold the indicator's own settings, never the chart's symbol, interval, session, lot size or footprint bin size, which follow the chart the indicator is on. See the Indicators guide.
  • Per-indicator defaults: Save as default makes the current settings the starting point for every new instance of that indicator you add from the Indicators browser, and Clear default returns new instances to the factory settings. Indicators already on your charts, saved layouts and synced charts are not changed.
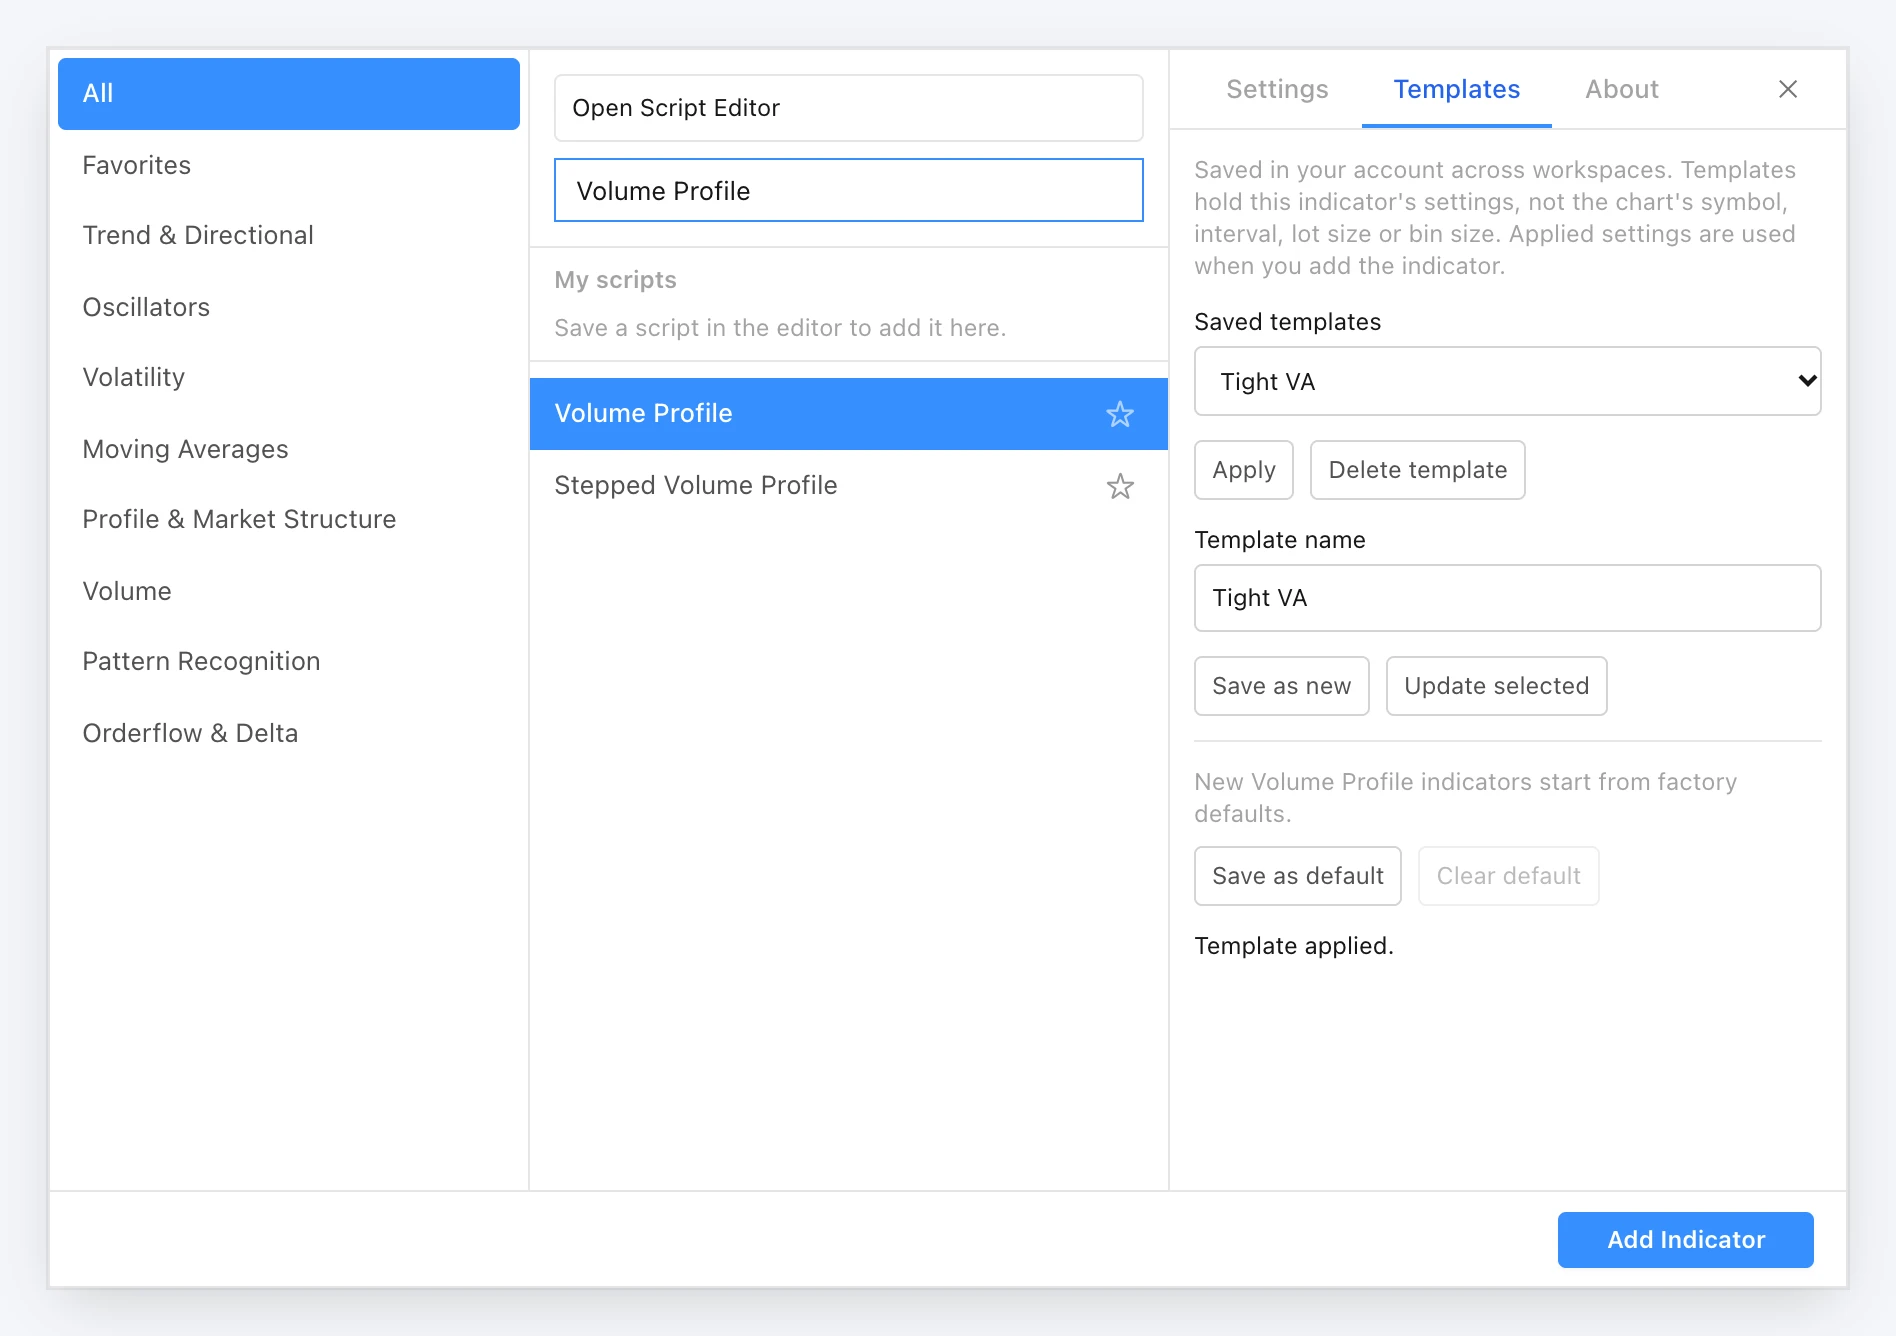
  • Choose a template before adding: in the Indicators browser, with an indicator selected from the library but not yet added, Apply sets the settings the Add Indicator button will use. Scripts keep their templates per saved library script, and indicator templates count towards your plan's template allowance alongside chart and drawing templates.
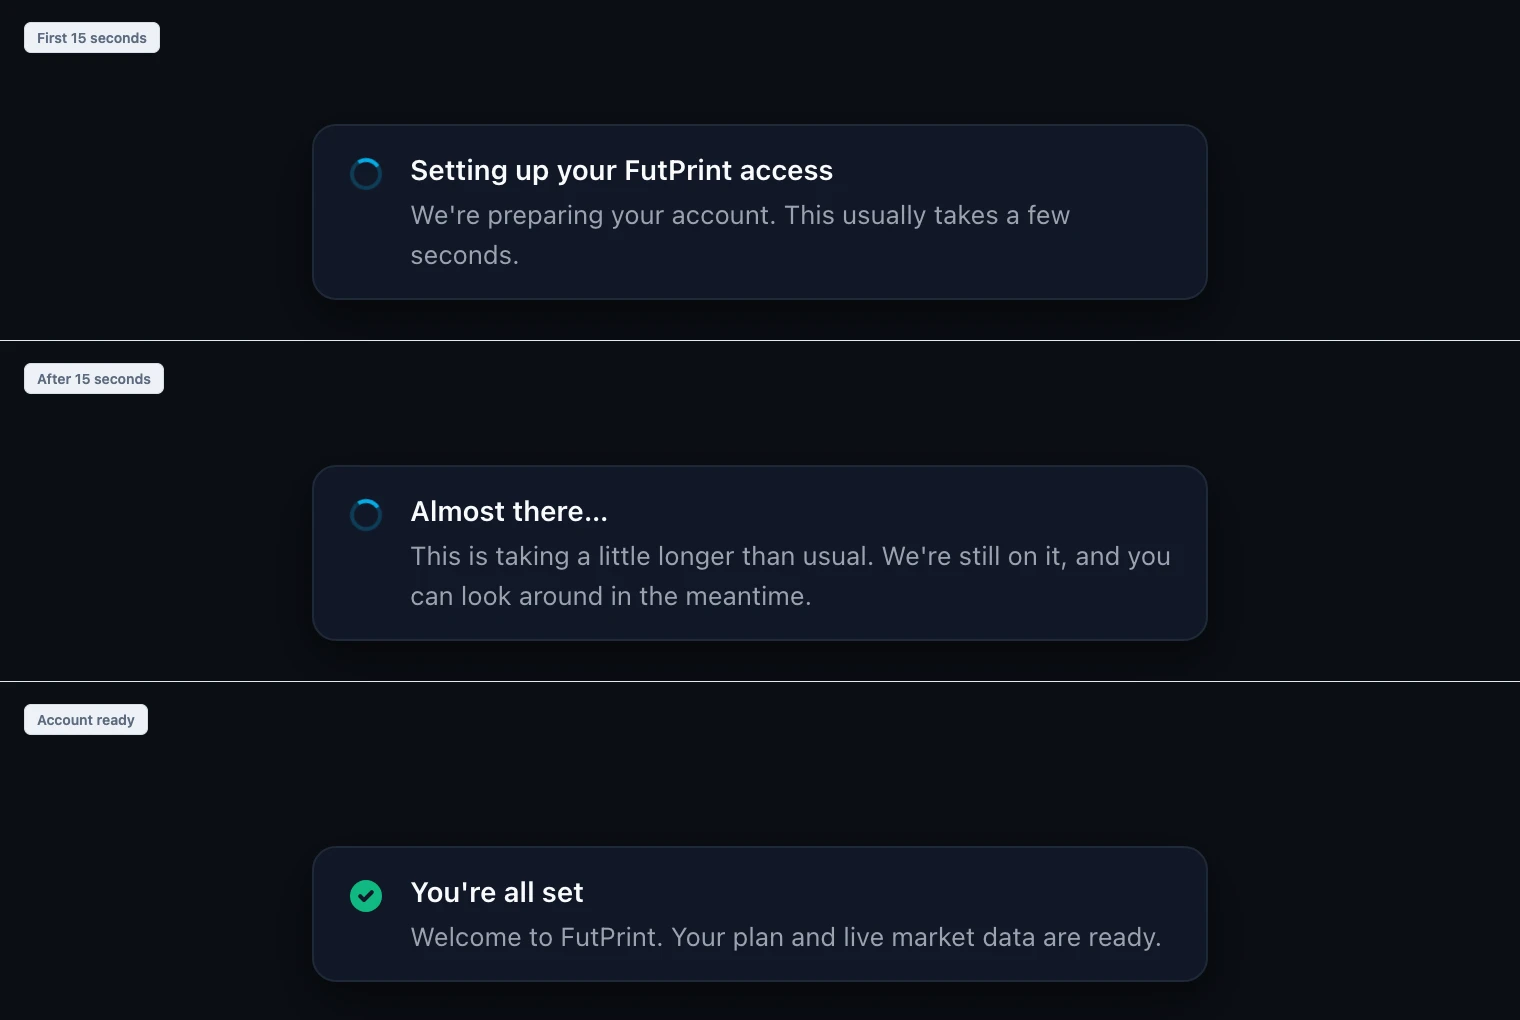
  • Setting up your FutPrint access: a new customer's account is created a few seconds after sign-up, and until now the terminal showed a blank plan in that gap. It now shows a notice at the bottom of the page while the account is being created, changes to "Almost there…" with a Check again button after 15 seconds, and ends with "You're all set" once the plan and live market data are ready. The referral code from a sign-up link and the default paper trading account now wait for the account instead of being lost. Existing customers never see the notice.
The Volume Profile settings dialog on its new Templates tab, with a saved template named Tight VA and the message "Default saved. It applies to indicators you add from now on."
The Templates tab in an indicator's settings dialog: saved templates, a name for the current settings, and the saved default for new instances.
The Indicators browser with Volume Profile selected from the library and its Templates tab open, the Tight VA template chosen and the message "Template applied."
In the Indicators browser, a template applied to an indicator that is not on the chart yet sets the settings Add Indicator will use.
The three states of the account setup notice: "Setting up your FutPrint access" in the first 15 seconds, "Almost there…" after 15 seconds, and "You're all set" once the account is ready.
The setup notice a new customer sees while their account is created, and the message once it is ready.

Improved

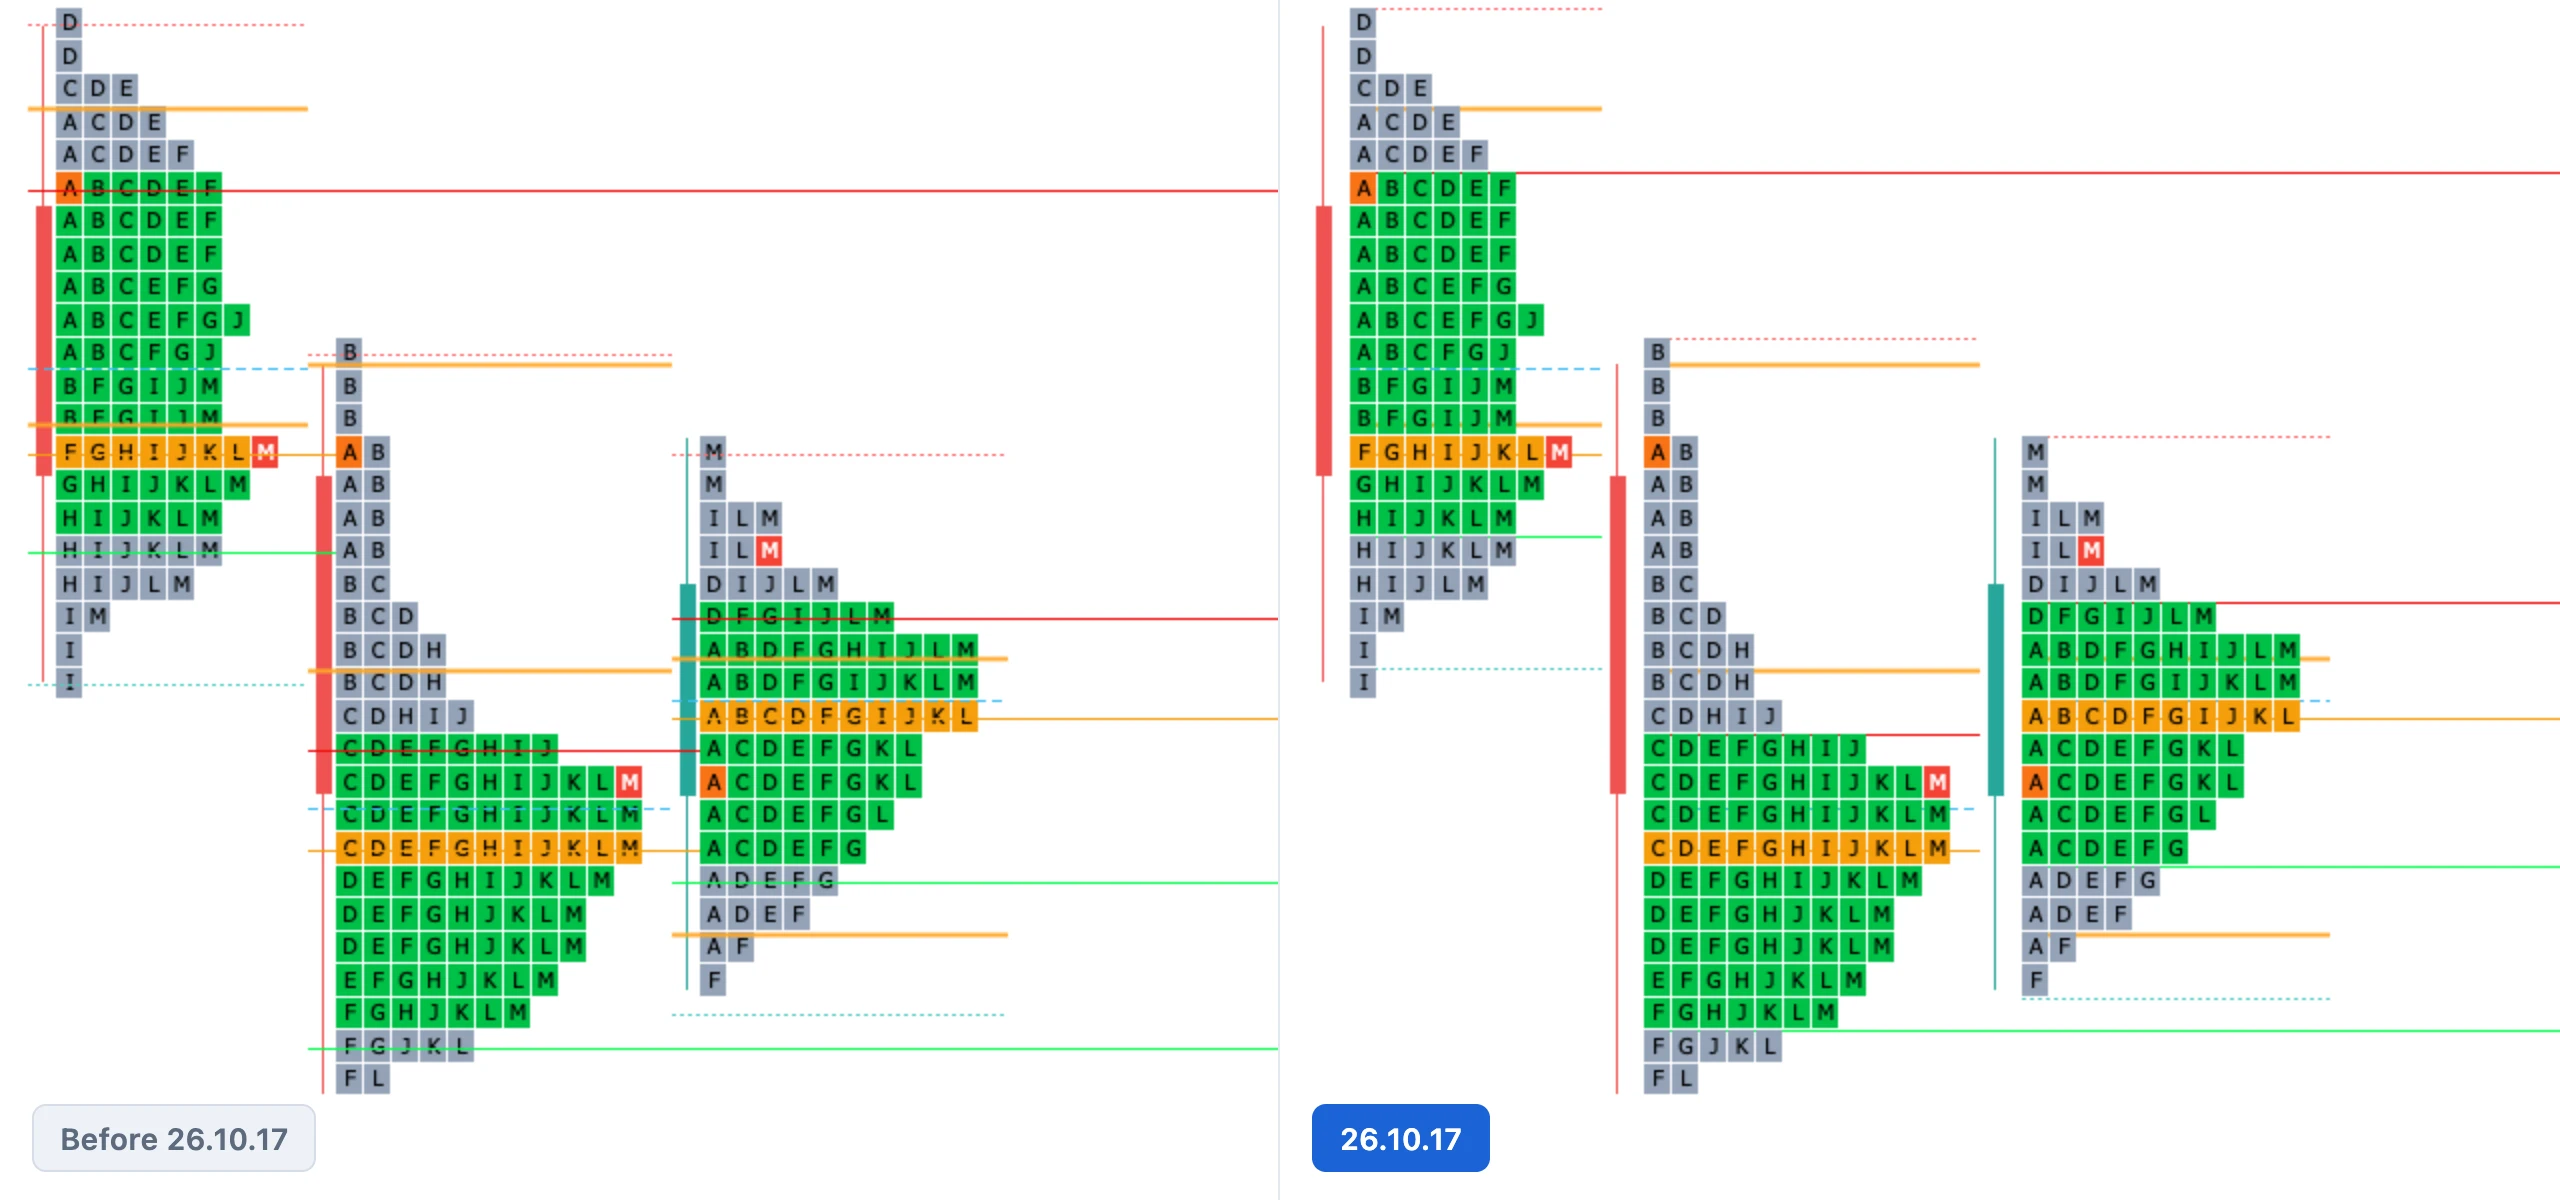
  • TPO level lines keep clear of the period candle. With Period Candle on, the POC, value area, VWAP and its bands, poor high and low, initial balance and the auction open-price marker start after the candle's slot, in both profile directions. Naked-level extensions stop at the column that revisits the level, so they end before that session's candle, and the candle slot is half as wide again so the profile sits visibly clear of it.
  • Level lines sit behind the letters. Level lines, the open-price marker and the extensions are painted before the TPO blocks, so they run out from under the profile instead of across the blocks and their letters. The auction arrow and its label still paint on top.
Two renders of the same three TPO sessions with Period Candle on. Before, the POC, value area and VWAP lines started at the candle and crossed the letters; after, they start after the candle slot, run out from under the blocks and sit on the row edges.
The same three sessions before and after 26.10.17: lines start after the candle, run behind the letters, and the value-area and poor-extreme lines sit on the row edges.

Fixed

  • Value-area and poor-extreme lines sat half a row low on the TPO chart. A TPO row is keyed by the bottom of its price bin, but the line positions assumed the row centre. VAH and Poor High lines now sit on the top edge of their row, VAL and Poor Low on the bottom edge, and the value-area background band matches. The POC line still runs through its row centre.
  • Big Trades showed nothing after a workspace restore. Big Trades sat in the legend of a restored chart with no markers until one of its settings was touched. Restored settings now reach the detector as soon as the tick history arrives, and lot size and tick size are no longer stale after a restore.
  • Composite volume profile over a period that was not on screen. A Composite Volume Profile set to Previous Month on the TPO chart stayed empty until you zoomed out far enough, because footprint volume loads only for the sessions in view. The chart now loads the days the composite needs as soon as it is added, for the Volume Profile indicator and the TPO chart's built-in volume profile alike. Day-range footprint loads no longer cancel each other.
  • Direct links to the web terminal. Since the 15 October deploy, opening a workspace link, /sign-in or /profile directly landed on the home page or a not-found page. Every address opens the right page again.
26.10.15Release

Big Trades on every chart type, TPO profiles that grow right to left, and a period candle beside each profile

Big Trades is now an indicator added from the Indicators dialog, so large executions can be marked on a plain candlestick chart as well as the cluster chart, with size labels that thin out as you zoom out. The TPO chart and the Market Profile indicator can anchor each profile at the right edge of its session, and the TPO chart can draw the period's candlestick just before its profile.

New

  • Big Trades indicator: Big Trades moves from the Footprint settings tab to Indicators ▸ Orderflow & Delta, so it can be added to candlestick, OHLC, Heikin Ashi, range bar, tick range and tick number charts as well as the cluster chart. Traders who want a clean chart keep the executions that matter without the cluster cells. Layouts saved with the old switch on keep their markers: the indicator is added to the chart and shows in the legend. See the Big Trades guide.
  • Labels follow zoom: the new default label mode works like the numbers in a cluster chart. Zoomed in, every marker shows its size; zoomed out, markers stay and only the largest prints keep their label, so a 500-lot print is still readable on a full-day view. Always Label From sets the size that is labelled at any zoom (five times the minimum lots unless you set it), and Labels can still be set to Always or Never.
  • Direction in the TPO chart's Profile Setup and in the Market Profile indicator's Basic Settings: Left to Right (the default) or Right to Left, which anchors the first period at the right edge of the session so the open and POC sit against the next profile. Split profiles are time-ordered and keep their period columns. See the TPO settings.
  • Period Candle in the TPO chart draws each session's open, high, low and close as a candlestick in a slot just before its profile, in the chart's candle colours. The current session's candle keeps updating as it develops.
26.10.13Release

CVD line styles and divergences, composite profile levels, symbol logos and a lighter terminal

The Cumulative Volume Delta indicator gets a full set of drawing styles with non-repainting divergences, composite volume profiles draw their own key levels, every symbol gets a logo, and the terminal downloads a third less code on first open.

New

  • CVD line styles add Bars, Line, Step, Area and Columns to the existing Candles style. Lines can be one colour, split above and below zero exactly at the crossing, or coloured by rising and falling, with width, dash and fill-opacity controls and a configurable zero line. Line styles now break at each reset instead of plunging to zero.
  • CVD moving average and delta histogram add an optional EMA or SMA overlay that restarts with each CVD reset, and a per-bar delta histogram in its own band at the bottom of the pane, also shown in the legend.
  • CVD divergences mark regular and, optionally, hidden divergences between confirmed price swings and CVD inside one reset period. Each is drawn as a line with a Bull or Bear label and only confirms after a set number of bars on both sides, so nothing repaints. The settings dialog now shows only the fields the chosen style uses. See the CVD guide.
  • Composite profile levels: the composite profile in Volume Profile, Stepped Volume Profile and the TPO volume profile can draw its own POC, VAH, VAL, LVN and HVN lines, spanning either the composite's width or the whole chart. All are off by default.
  • Symbol logos for 3,395 instruments appear in Watchlist rows, Heatmap tiles, the chart header, the ticker strip, symbol search, Add Symbol, alert search and the options underlying search. Futures, options and rolling contracts resolve to their underlying; MCX commodities and BSE indices use bundled glyphs; symbols without a logo show an initials avatar.
  • App version in the profile menu and workspace header, shown as v26.10.13, and reported with every analytics event and API request so support can see exactly which build you are on.

Improved

  • Linear volume profiles are coloured per level. They were previously drawn in the single colour of the lowest level; each level now takes its own colour, switching halfway between neighbours, as the Step style already did.
  • CVD legend and last-value label use the colour the pane is drawn with.

Fixed

  • Step and Linear volume profiles no longer look like they are floating. The outline was open on the base side; it now joins the lowest and highest levels back to a base line, in the indicator, the Fixed Range drawing and the TPO profile.
  • Version string no longer shows the build commit after the version number.

Performance

  • The terminal downloads about 300 KB less JavaScript on first open. The Script Editor, Broker login, Trading, Orders, Positions, Depth of Market, Tick Analyser and Options Print panels, the screenshot engine, the colour picker and the VWAP date picker load on first use. On a throttled 4G connection the terminal is interactive in 1.21 s instead of 1.55 s.
  • The offline cache shrinks from 23.8 MB to 3.7 MB. Website and documentation screenshots are no longer downloaded in the background on your first visit; they are cached when viewed. The terminal is ready for offline use in 21 s instead of 43 s on a 9 Mbps line.
  • Symbol logos are fetched on first use and cached for seven days, instead of 46 MB of images being downloaded when a workspace opens.

Desktop apps

  • Desktop build 26.10.13 for macOS and Windows includes everything above.
UpdateMajor release

Options analytics rebuilt: one pricing model, Spread Scanner, IV Smile, Gamma Exposure and Option Strategies

Rolled out to the web terminal between 10 and 12 October and included in desktop build 26.10.13. Every option panel now prices from the same forward, the Option Chain absorbs multi-strike OI analysis across several sessions, and two new panels price spreads and the volatility smile.

New

  • Spread Scanner panel prices every call, put and iron butterfly, or 1:N ratio spread, around the money as a grid of centre strike by wing width, coloured from cheap to rich. Each cell shows net debit or credit, cost as a percentage of the wing, reward to risk, break-evens, slippage and minimum open interest, with mid, LTP or executable pricing per unit or per lot. Spread Scanner guide.
  • IV Smile panel solves implied volatility for every call and put strike, fits a vega-weighted curve in log-moneyness and shows rich and cheap residuals, ATM IV, the 25-delta risk reversal and butterfly, skew slope and the richest and cheapest strikes, as a chart on a strike, moneyness or delta axis, or as a table. IV Smile guide.
  • Gamma Exposure rebuilt for accuracy. Legs are priced off a parity-implied forward, out-of-the-money volatility is borrowed for in-the-money legs, dead strikes are interpolated and walls are gamma-weighted. New views include the net-GEX profile curve the flip is read from, a change-in-OI GEX view, a concentration view, six metric tiles, a session history strip, percentage strike scopes and a warning when the contract is expiring. Gamma Exposure guide.
  • OI Analysis inside the Option Chain. A Chain, Split and Analysis switch lets you select CE or PE rows or strike pairs and open a resizable pane with range aggregates, RTH and ETH sessions, a timeline and Overview, Price, Volume, OI and OI Change tabs. The separate Multi-Strike OI Analysis panel is retired; saved layouts convert automatically. Option Chain guide.
  • OI analysis across several sessions. A Days control loads 3, 5 or 10 trading days of 5- or 15-minute bars; overnight gaps collapse so open-interest build-up reads as one line, and OI change is measured from the first bar of the window.
  • One pricing model across option panels. The Option Chain, IV Smile and Gamma Exposure previously implied three different volatilities for the same strike. All now resolve the same forward, from put-call parity, else the future, else spot carried at the risk-free rate, so header ATM IV, straddle, expected move and row greeks agree everywhere.
  • Expiry-eve strangle card. On the afternoon before a weekly index expiry, the Option Chain's market-context strip shows an Expiry eve pill. Its card names the strangle or iron-condor legs picked from the live chain, the credit per lot after charges, the closing range required, break-evens and the maximum loss, with the tail risk stated plainly. The chain tags the strikes.
  • Option Strategies rebuilt. A metric-card strip shows P&L after charges, probability of profit, exact maximum profit and loss, net premium with break-evens and estimated margin, alongside position greeks, expected move and touch probabilities. The payoff chart gains dated value lines, an IV shift, one- and two-sigma bands, strike ticks and a target; a price-by-date P&L surface, greeks versus price and session series for P&L, premium, OI and greeks with adjustment markers are new. Build quickly by ATM width, delta, premium or percentage OTM, with futures legs, and keep a saved-strategy library. Option Strategies guide.
  • Option Strategies backtester upgrade. Strike selection by delta, premium, percentage OTM and straddle width; nearest, next or monthly expiry rules; per-leg entry times with wait-and-trade; weekday and days-to-expiry filters; positional holds across sessions; and new statistics including per-trade win rate, profit factor, intraday mark-to-market drawdown, monthly and weekday tables and Sortino. Fills use the last print at or before the spot bar on the 0.05 tick.
  • Option Strategies: Chain tab, replay auto-exit and Suggest. The Chain tab plots call versus put OI, PCR, max pain, ATM IV and the ATM straddle through the session. Auto-exit closes all legs at a profit, loss or time as replay advances. Suggest ranks strategies by value at the payoff target and date. Right-click any chain cell to buy or sell it as a leg, open its chart or Time & Sales, trade it or add it to a watchlist.
  • Gamma Blast tuned for index futures. Every leg is priced off the expiry forward with a new Chart Is a Future setting; NIFTY futures, rolling contracts and option symbols resolve to the underlying; expiry rolls automatically at 15:30; the OI unit (quantity or lots) is detected so exposure is not double-counted; and defaults are tuned for index futures. Gamma Blast guide.

Improved

  • Shared chain feed. One subscription per contract now serves every open option panel. The chain shows the previous session's closes and OI when nothing is ticking instead of empty rows, and retries other option exchanges when an instrument's exchange lists no contracts.
  • Power Scanner prints and sweeps are sized to each symbol's own session. Large Print no longer floods and Sweep now fires: both require a multiple of the symbol's average minute of volume today, the sweep window grows from 1.5 s to 5 s, OI findings need a 0.5% change instead of 2%, findings no longer depend on when the panel was opened, and overnight scanners start the new session clean.
  • Formula Chart locks unsupported indicators. Tick-based and chain-based indicators are shown locked with a reason on formula charts instead of mounting empty.

Fixed

  • Far out-of-the-money index strikes no longer collapse to the volatility floor; the IV solver tolerance was corrected.
  • Formula Chart results from Add symbol in custom mode were clipped by the toolbar and are now visible; chart mode (TPO or candle) is mirrored into the straddle configuration and saved; the RTH and ETH toggle now changes the data.
  • Option Chain grid no longer shows a blank spacer at the top after returning from the Analysis layout.
  • Option Strategies in live mode: a date change cleared the chain without reloading it, legs were judged open by bar index instead of exit state, and hover actions in the LTP cell were clipped in narrow splits. Jade lizard templates were corrected.
26.10.8Patch

TPO naked levels: extend VWAP, Poor Highs and Poor Lows until they trade

Market Profile gains the extension settings profile traders ask for most: naked VWAP, Poor High and Poor Low lines that run forward until price revisits them, plus a choice of how single prints extend.

New

  • Extend Naked VWAP, Extend Naked Poor High and Extend Naked Poor Low are new TPO settings. Each level extends through later profiles until its price bin trades again, so untested levels stay visible on the chart.
  • Single Print Extend chooses whether single-print zones extend Until Intersection or Until Session End. See the TPO settings guide.

Desktop apps

  • Desktop build 26.10.8 for macOS and Windows.
26.10.7Patch

CVD resets on the exchange calendar, readable legends and desktop panel dragging

A follow-up to the CVD accuracy work, a quieter on-chart indicator list, a fix for linked panels that opened empty, and a desktop build that is seven times smaller.

Improved

  • Indicator legend is readable and hover-only. Legend values and axis labels pick black or white by contrast in dark mode, and the on-chart indicator list shows its background and controls only on hover or focus. A maximised pane now starts below the header toolbar.
  • Panel linking picks a live symbol. Linking a panel to a colour group copies the symbol from an open panel, and stale link entries for closed panels are dropped on restore. Previously a newly linked Time & Sales, Option Chain or Watchlist could stay empty.

Fixed

  • CVD resets follow the exchange calendar. Session, Daily, Weekly and Monthly restarts use IST (UTC for crypto) with Monday-start weeks, not the browser timezone, and the forming bar's delta high and low match history so wicks no longer change on reload.
  • Time axis crash in TPO. Zooming a stacked TPO chart far past the loaded data could crash the time axis; the label scan now stays inside the data.

Desktop apps

  • Workspace panels can be dragged in the desktop app. The desktop shell was swallowing drop events. Text is no longer selected while resizing panels, and the webview's own right-click menu is suppressed.
  • The macOS installer is back to about 22 MB from 154 MB: documentation screenshots are left out of desktop bundles.
26.10.6Major release

60 new indicators, 34 new drawing tools, accurate CVD and live footprints, and a drawing toolbar in twelve categories

The largest single-day expansion of the charting library, two correctness fixes every order-flow trader will notice, and a drawing toolbar reorganised into twelve categories with an icon for every tool.

New

  • 60 new native indicators, including ALMA, DEMA, TEMA, HMA, KAMA, VIDYA, ZLEMA, T3, McGinley Dynamic, Envelope, Donchian and Keltner Channels, Aroon, Balance of Power, DPO, Momentum, Chande Momentum, Coppock Curve, Fisher Transform, Vortex, Ulcer Index, Historical Volatility, Chaikin Money Flow and Oscillator, Ease of Movement, Bollinger %b and BandWidth, Accumulation/Distribution, Klinger, Mass Index, Williams Alligator, Elder-Ray, True Strength Index, SMI Ergodic, PPO, PVO, PVT, NVI, PVI, Choppiness, Chandelier Exit, Volatility Squeeze, Moving Average Ribbon, MA Cross, 52 Week High/Low, Consolidation and Breakout, Standard Error Bands, BBTrend, Linear Regression Slope, LSMA and more. Every calculation was verified bar by bar against a reference implementation. Indicators guide.
  • 34 new native drawing tools: Extended Line, Arrow, Horizontal Ray, Cross Line, Ellipse, Circle, Triangle, Polyline, Arc, Curve, Double Curve, Rotated Rectangle, four directional arrows, Price Range, Date Range, Fib Channel, Fib Time Zone, Fib Fan, Gann Fan, Gann Box, Cyclic Lines, Time Cycles, Sine Line, Pitchfork with Schiff, Modified Schiff and Inside variants, Parallel Channel, Elliott Impulse, Elliott Correction and Head and Shoulders, all with undo and redo and saved with the workspace. Drawing tools guide.
  • Drawing toolbar in twelve categories with distinct icons: Lines, Channels & pitchforks, Fibonacci, Gann, Shapes & paths, Cycles, Patterns & waves, Arrows, Risk & reward, Volume studies, Measure & zoom and Annotations. Each button opens a flyout with icons and shortcuts and remembers the last tool used.

Improved

  • Time axis labels name only what changed. Each label shows the year, month, day or clock time that is new, so repeated labels such as "27 Sep 27 Sep" are gone. Label steps are sized from the candles a session really holds, multi-day steps count trading sessions, new 2-day, 3-day, half-month, half-year and multi-year steps were added, and daily and higher timeframes draw vertical grid lines.
  • Footprint numbers are readable in both themes. Each cell picks its text colour from the painted background, and cell emphasis shades away from the canvas colour so the strongest cells no longer vanish on dark charts.
  • TPO letters stay readable on their block: the letter colour falls back to black or white when the configured colour lacks contrast.

Fixed

  • CVD is consistent across timeframes and live on the forming bar. CVD now accumulates each candle's canonical delta instead of re-summing footprint levels, so values match between timeframes and the on-candle CVD statistic no longer freezes at the snapshot.
  • Live trades are no longer double-counted after a history load. The forming candle's cluster showed roughly twice the traded volume after opening a chart or switching timeframe. Live trades are now merged by arrival order against the history snapshot and replayed last trades are excluded, verified on 4,243 one-minute candles across seven symbols. Live seconds with several prints are booked the way history is, so levels and delta match after a reload.
  • Option Chain call and put tables scroll together again. The scroll handlers attached before the tables existed; they now re-run when loading completes or the symbol changes.
26.10.5Major release

FutPrint for Mac and Windows, drawing templates, settings recovery and unified panel headers

The terminal becomes a native desktop app with its own window, Dock icon and keychain-stored sign-in. On every platform, drawings gain templates and exact coordinates, settings dialogs can be cancelled and reset safely, and every panel takes the chart header's controls.

New

  • Drawing templates and tool defaults. A Templates tab on a selected drawing saves a named look, applies it to other drawings of the same tool, and Save as tool default sets the look for future placements. Templates sync with your account.
  • Exact drawing coordinates. A Coordinates tab exposes each anchor's date, time and price for direct editing, snapped to the instrument's tick size; long and short position tools expose entry, target and stop.
  • Settings recovery. Chart, indicator and drawing settings preview edits live, and Cancel or Escape restores them. Built-in indicators get Reset to defaults, custom scripts get Reset inputs and Reset style, drawings get Reset settings and Undo reset, and the header reset button resets only the selected section.
  • Shared recent colours. The colour picker keeps the last twelve colours used across chart, indicator and drawing settings, with opacity preserved.
  • Dockable Data and Layers panel. The Data Inspector and Layer Manager open in a shared, resizable dock on the right that can be floated back to a window; on wide charts the dock reserves space instead of covering candles.
  • Left price scale controls. Right-click the left-axis gutter for Auto-fit or Reset scale on that axis only; double-click the gutter to reset.
  • Extend Until modes for profile levels. Each extended POC, VA, LVN and HVN line in Volume Profile can stop at the first price intersection or run through the end of the next session. The Stepped Volume Profile is rebuilt on the Volume Profile engine so it shares these options.
  • Unified panel headers. Every terminal panel takes the chart header's styling: the same symbol picker placed first in every header, segment-style view toggles, feed status at the right end, and shared dropdowns.
  • H/L Scanner upgrade: linked-panel symbol selection, a right-click menu, a grouped view, a virtualised list, search and sort, add to watchlist, alerts and saved state. H/L Scanner guide.
  • Bundled fonts. Inter and Geist Mono ship with the app so Windows and Linux match the macOS look; Apple platforms keep San Francisco and SF Mono.

Improved

  • Chart and panel toolbars scroll sideways with the mouse wheel or trackpad when they overflow.
  • Option Chain repaints in step with the ticker strip (every 250 ms), so spot and future prices and chain rows no longer disagree.
  • Multi-Strike OI Analysis on holidays walks back up to five weekdays to the latest day with data and keeps all strikes on that same day.
  • Option Chain hover inspector keys on the strike only and has fixed dimensions for a steadier layout.
  • Order, position and alert lines share one subdued trading-line style with opacity, consistent in exports.

Fixed

  • Options Print no longer reports No expiry found. Expiries come from the dedicated expiries endpoint instead of a search filled with expired contracts, and empty results are no longer cached.
  • Feed symbols for two-digit-year expiry formats are validated so corrupt symbols cannot be requested.

Desktop apps

  • FutPrint for macOS and Windows. The same terminal as a native app: a universal macOS disk image for Apple silicon and Intel, and a Windows installer that needs no administrator rights. Sign in with email and password in the app or with Google through your browser; your session is stored in the operating system keychain. Workspaces, layouts and plan carry over from the web. Download for Mac · Download for Windows.
  • Desktop versions follow the release date (26.10.5), with a content security policy, website-only media left out of the bundle and installers published with every tagged release.
26.10.4Release

Price-axis controls, pinned timeframes, compact legends and charts that remember their history

Chart workflow controls arrive on the price axis and in the interval menu, composite volume profiles can cover fixed ranges, and downloaded history is kept in the browser so reopened charts load from the last cached day.

New

  • Price-axis quick controls. Right-click the main price axis to toggle auto-fit, switch between linear and log, reset the price scale without resetting time, or open Scales & lines settings. Indicator-pane axes get reset and settings menus, and a double-click resets them.
  • Compact indicator legends show the hovered or latest candle's values inline, up to three readings with an overflow tooltip, compact units for large volume and delta, and a settings button to show or hide parameters and values.
  • Pinned timeframe shortcuts. Star intervals in the interval dropdown to choose which appear as toolbar shortcuts, pin custom intervals, and use Reset pins to restore the defaults. Pins are saved per account.
  • Composite volume profile ranges. The composite profile can aggregate the previous day, the current or previous week, the current or previous month, or the last N trading days instead of only the visible profiles. Two-sided profiles get a Left or Right position in the indicator, the Fixed Range drawing and TPO mode.
  • OHLC history is kept in the browser. Downloaded bars are stored per series in memory and in IndexedDB, so reopened charts and page reloads refetch only from the last cached trading day. History also arrives as compressed binary frames, cutting download size.

Improved

  • Only the dragged drawing repaints while you move it, and Market Profile now renders inside the main chart pipeline.

Fixed

  • Scrolling back through history no longer skips a day. The older page ended a day early because the server excludes the end instant; pages now end exactly at the loaded start.
  • Theme switches repaint the chart even when the market is closed, instead of keeping the old colours until the next tick.

Performance

  • Chart workers start on demand: an unused footprint worker was removed, tick workers start only when tick history is first parsed, and the drawings canvas is released when idle.
  • Off-screen volume profile bars are skipped and the per-frame sort runs only for Linear and Step styles.
  • Panels opening together share one history request per time window and one tick request per session instead of each fetching its own copy.
  • Broker orders and positions are written to storage once per poll and only when something changed.
26.10.3Release

Data Inspector, chart-wide undo and redo, and instrument comparison on one scale

A crosshair-following inspector shows everything the chart knows about a candle, every chart edit can be undone, and up to four instruments can be compared on a shared percentage scale.

New

  • Data Inspector. A movable, resizable panel follows the crosshair and shows OHLC, change, volume, open interest, order-flow readings, native indicator values, custom-script plots and comparison values. Pin a candle, step with the arrow keys and copy readings with timezone context; values persist through indicator recalculation instead of flashing.
  • Chart-wide undo and redo cover chart settings, chart mode, indicator changes and visibility, pane resizing, drawings, comparisons and symbol or interval changes, up to the last 100 edits. Live ticks do not create history entries.
  • Instrument comparison on a shared percentage scale. Compare up to four instruments from the compare icon beside symbol search. Time-based charts switch to a percentage scale based on the first common visible candle, lines stay continuous across missing candles, and a comparison strip offers colour, visibility, removal and the crosshair's percentage change. Not available on tick, Renko, Kagi, Point & Figure or stacked TPO charts.
  • Profile actions grouped in the chart context menu. Each profile's alerts at POC, VAH and VAL, plotted levels, merge and unmerge sit in their own submenu, with a new option to create alerts at all levels.

Improved

  • Crowded price labels are packed by priority with collision avoidance and connectors to their true price; native, script, drawing, trading and comparison labels all share the treatment. Indicator panes can be maximised and restored.
  • Chart mode icons. Each chart mode has its own icon in the mode selector instead of one generic chart glyph.
  • Alert errors are specific. Creating, updating or deleting an alert now reports the actual message from the server.
26.10.2Release

Date navigation, linked time ranges, chart export and order-flow fields for custom scripts

Jump to any date and get the exact chart back, keep linked charts on the same time range, export charts at print resolution, and read buy and sell volume, delta and CVD from your own indicator scripts.

New

  • Date Navigation panel. Jump to a date or range and get the symbol, interval, indicators and drawings restored exactly as they were.
  • Linked time ranges. Charts in the same link group keep their visible time range in sync as you scroll and zoom.
  • Chart export redraws the chart and indicator panes at up to four times resolution without the app frame, crosshair or drawing handles. Choose a high-resolution PNG, SVG, copy to clipboard, or a CSV of the loaded data.
  • Order-flow data in custom scripts. Scripts in the Script Editor can read buy volume, sell volume, delta, delta percentage, delta high and low, CVD and trade counts, with Order flow delta and Loaded-history CVD examples to start from. Script Editor guide.
  • Style tab for custom indicators. Change plot colour, style, width, offset and visibility, signal text, shape, size and position, levels, fills and table appearance per chart without touching the script.
  • Per-indicator timeframe for moving averages and RSI, so a daily average can sit on an intraday chart.

Improved

  • Smoother scroll zoom. Wheel zoom glides over about 200 ms at 12% per notch instead of jumping.

September 2026

26.9.30Major release

Script Editor: write your own indicators in OpenScript

Custom indicators arrive in FutPrint. Write a study in the built-in editor, save it to your account and apply it to any chart with inputs generated from the script. Volume Profile settings are reorganised for two-sided profiles.

New

  • Script Editor. Open it from Widgets or from Indicators with Open Script Editor. The editor offers diagnostics, completion, hover help and formatting, and starts you with an EMA cross study. Save, save a copy, rename, delete, import and export source, and recover a local draft if you close the tab mid-edit. Script Editor guide.
  • My scripts. Saved scripts appear under Indicators as My scripts. Inputs are generated from the script's input declarations and saved per chart; Edit source and Update from library control which version a chart runs.
  • What scripts can draw. Line, step, area, histogram, column and candle plots, fills, levels, signals, candle and background colours, tables and drawings. Scripts can read another symbol through the market-data service. They run in a dedicated worker with limits of 50,000 bars, 100 KB of source and a 10-second watchdog, so a runaway script cannot freeze the terminal.
  • Nested Volume Profile settings. Left and right profile settings are grouped as nested properties in the settings grid with Histogram, Linear and Step rendering styles. The Fixed Range Volume Profile drawing now shares the indicator engine, and older saved drawings are translated automatically.

Fixed

  • TPO letters keep their place when the volume profile width changes in TPO mode; the pan offset is re-based instead of shifting the letters.
26.9.27Release

Two-sided volume profiles, chart recovery after reconnects and safer workspace saves

Rolled out between 19 and 27 September. Volume profiles can show two metrics side by side, charts rebuild themselves cleanly when a connection drops or a tab returns from the background, and workspace saves can no longer overwrite each other.

New

  • Two-sided volume profiles. Standalone Volume Profile and TPO volume profiles can be Two Sided, with left and right halves each showing Volume, Delta or Bid × Ask, or Single Sided. TPO volume profile settings are completed with Stacked and Mirrored layouts, Total Volume, Solid, Dashed and Dotted line styles and Highlight Conditions. Volume Profile guide.
  • Chart recovery. When the connection reconnects, the tab returns to the foreground, the browser restores the page or you press refresh, the chart reloads its full OHLCV and footprint history (and raw ticks for Big Trades on Max) and swaps it in atomically, so the old live tail is retired. If the reload fails the existing chart stays and a Retry button appears. A socket that is open but silent is now detected and recovered.

Improved

  • Several charts on the same symbol load reliably. Opening multiple panels on one symbol and timeframe no longer leaves one with zero bars; each panel hydrates its own history while in-flight requests are shared, and symbol switches cannot publish stale results.
  • Safer workspace saves. Saves carry the server revision. If the workspace changed elsewhere you see "This workspace changed or was removed elsewhere. Your changes are still here. Reload it or save a new copy." instead of a silent overwrite or a duplicate. Edits made during a save stay unsaved, malformed layouts are rejected before they replace the current one, and chart restore failures are reported rather than saving partial state.
  • Linked crosshair accuracy. A linked crosshair now lands on the candle that contains the source timestamp rather than the next one, and falls back to time-only linking when a symbol is unknown.
  • Workspace themes move to neutral surfaces in dark and light mode with the FutPrint blue as the accent for active states, inputs and borders, replacing the old teal.

Fixed

  • Free plan limits match the pricing page: one chart, two indicators, no option chain and no alerts. Alerts had been unlimited on Free by mistake.

Performance

  • Footprint cache and request queue. Cache keys were corrected, in-place corrections now invalidate the cache, snapshots are kept within an 8 MiB budget, and a bounded request queue with cancellation prevents history request floods during fast scrolling.

August 2026

26.8.27Major release

Gamma Exposure panel, Big Trades in replay and a strategy analytics chart

Rolled out between 18 and 27 August. A new Options Trading module maps dealer gamma exposure strike by strike, Big Trades markers now appear during tick replay, and the strategy builder gains a multi-series analytics chart.

New

  • Gamma Exposure panel (Add Widget, Options Trading). Strike-by-strike dealer gamma exposure for a chosen underlying and expiry with ±10, ±20, ±30 strike or full-expiry scope, Call, Put and Net views, Spot, FLIP, CALL WALL, PUT WALL and PEAK Γ lines, four summary cards, hover and pin tooltips, wheel zoom and pan, a coverage badge, an OI units selector, an invertible sign convention and a previous-session fallback when the market is closed. It saves with the workspace and joins symbol link groups. Not on Free, one panel on Lite, unlimited on Pro and Max. Gamma Exposure guide.
  • Big Trades during tick replay. The detector now runs on replayed ticks, so markers appear on forming candles as a session replays.
  • Strategy analytics chart in the strategy builder: a multi-series chart with tooltips beside a slimmer payoff chart, and shared header controls for expiry, lots, side, live or historical mode and playback speed across the Option Chain, Multi-Strike OI and Historical Option Chain panels.

Improved

  • Footprint cells layer predictably. Rendering is split into text, background and border layers with a defined order, so base volume, vPOC, side POC and imbalance highlights stack independently and no state hides another. Bid and ask cells can be styled separately and triple-mode POC borders draw per section.

Fixed

  • Chart screenshots no longer capture a blank neighbouring region, and hidden canvases are ignored when sizing the capture.
26.8.14Patch

Indicator price lines, email notification preferences and restyled replay controls

Any indicator can now show a last-value line and label on the price axis, you choose which emails FutPrint sends you, and the replay controls match the rest of the terminal.

New

  • Indicator last-value lines. Any indicator can show a price line and label for its latest value, with Solid, Dashed or Dotted style, line width, and switches for the line and the label.
  • Notification preferences on the profile page let you choose which emails you receive from FutPrint.

Improved

  • Option strike data modal parses expiries and normalises the underlying more reliably and gains a Refresh button.
  • Replay controls are restyled to the shared theme, with Step, Speed and Exit replay mode.
26.8.5Release

Options Flow Pulse, Modern VWAP and a cleaner candle statistics panel

The Derivatives Positioning panel becomes Options Flow Pulse, ranking option flow events by open interest, volume and premium movement. A new adaptive VWAP indicator and a redesigned on-chart statistics panel follow a day later.

New

  • Options Flow Pulse (formerly Derivatives Positioning) ranks option flow events by OI, volume and premium movement over a comparison window, with a minimum flow score, sorting by score, volume, OI move or premium move, a Bias and Flow regime of Bullish, Bearish or Balanced, Net and High conviction readings, and classification into Long buildup, Short buildup, Short covering, Long unwinding and Exit flow. Double-click an event to open the contract chart or option chain. Derivatives Positioning guide.
  • Modern VWAP indicator. A composite anchored VWAP with efficiency-ratio regime bands and gated mean-reversion and trend-continuation signals, running three anchors (Session, Swing and Week by default) with an adaptive mode and signal plotting. VWAP guide.

Improved

  • Candle statistics panel redesigned. Volume, delta, CVD and COT high and low render in one panel sized to the candle slot, with font and spacing scaled to candle width. It hides when candles are too narrow instead of overlapping, uses the server's closing delta, and an outline-only style keeps the chart visible. Per-statistic colour and label settings were removed.

July 2026

26.7.31Patch

Historical tick access by plan, and PCR with tooltips in the Option Chain

Tick charts and historical Big Trades now follow the plan rules, and the Option Chain inspector explains every metric it shows.

New

  • Put-Call Ratio and its change join the Option Chain inspector, with tooltips explaining OI, change in OI, volume, IV, PCR and change in PCR. The inspector no longer closes before you can read it.

Improved

  • Historical raw ticks follow your plan. Tick charts and historical Big Trades load on Max; real-time tick features run on Pro and Max; data is cleared if access lapses. Options Print always resolves the underlying index or continuous future rather than a single call or put.
26.7.30Release

Big Trades, projected P&L on order lines and Heatmap index categories

Rolled out between 28 and 30 July. Big Trades replaces Power Trades with worker-based detection from raw ticks, order and position lines show what a trade is worth, and the Heatmap learns NSE index constituents.

New

  • Big Trades replaces Power Trades. Large aggressive executions are plotted at their traded price and time, live and reconstructed from historical raw ticks in a background worker. Settings cover Individual or Cumulative detection, group window and price tolerance, aggressor side, minimum and maximum lots, marker shape, size scaling and opacity, buy and sell colours, labels in lots or quantity and a visible marker budget. Buy and sell classification uses bid and ask quotes, falling back to the tick rule, and changing a filter reprocesses cached ticks without refetching.
  • Projected P&L on chart lines. Target and stop order lines show the projected exit profit or loss (or the order value for entries) on a second row; position lines show the trade and entry on the first row and live mark-to-market on the second.
  • Heatmap index categories. Browse NSE index constituents, keep a My heatmap symbols list and right-click a tile to open panels for that stock. Heatmap guide.
  • Market Pulse adds Sector leadership, Market stance, Price breadth, Confluence and Extremes cards, a Focus list and an Evidence tape; repeated detector prints are de-duplicated per symbol before scoring. The Option Chain gains cross-expiry positioning, wall flow and a scrollable market context strip. Market Pulse guide.

Improved

  • Chart colours follow the workspace theme. Background, crosshair and text colours sync to the active theme without touching your other chart preferences.
  • Option Chain quantities can be shown in full or compact form with Format non-price columns, remembered per workspace.

Fixed

  • Option Chain change column handles missing values without errors.
26.7.27Major release

Paper trading on the server, a trading Journal, the Scalper panel and community workspace templates

Rolled out on 26 and 27 July. The Trading, Orders and Positions panels return, backed by paper accounts matched and filled on the server. Closed paper trades flow into a new Journal, and workspace layouts can be shared with the community.

New

  • Server-side paper trading. The Trading, Orders and Positions panels are back in the Add Widget picker, connected to a paper-trading engine that matches, fills, charges and margins orders on the server and pushes updates over the live connection. A Paper Accounts modal creates named accounts with a custom starting balance, and lets you rename, reset or delete them. The Trading panel shows funds, balance, available margin and margin used. Trading & review.
  • Journal panel. Closed paper trades are journalled automatically with their fields locked. Add manual entries with symbol, quantity, entry, exit, notes, setup, tags, mistakes and a one-to-five rating, write day notes, filter by calendar day, account or source, and see trade count, win rate and cumulative realised P&L.
  • Scalper panel. One-tap market orders with live cost, margin estimate and day range, lot plus and minus controls, a strike switch and a trading account selector. Paper accounts only.
  • Community workspace templates. The Workspace Manager gains a community tab to browse layouts by Analysis, Futures, Options, Trading, Multi-Chart and Yours, sort by most copied, most favourited or recently updated, search, and publish your own template with a description and tags.
  • Rolling ATM straddle chart and overlay. The Straddle Chart panel can render a server-computed rolling ATM straddle for an instrument, expiry and interval with straddle price, strike, width and spot readouts. A new ATM Straddle Overlay indicator plots spot and the synthetic future on a left price scale with VWAP and marks where the ATM strike rolled.
  • Power Scanner alerts and feed health. In-app notifications with a minimum severity, connection status with last-frame age, and two new detectors: Failed Auction (a new session extreme rejected immediately) and H/L Retest. Power Scanner guide.
  • STOP orders use the trigger price as the canonical price, so order lists and chart order lines show the right level.

Improved

  • Straddle VWAP continuity. The Straddle Chart polls from the start of the IST trading day so VWAP no longer jumps on incremental refreshes.

Fixed

  • Paper positions and orders stay in sync. The latest live position event per account wins over stale snapshots, orders and positions reconcile without replacing local objects, chart trading lines sync across accounts and concurrent syncs are serialised.

Performance

  • Chart history over the live connection. Footprint and OHLCV history are requested over the existing WebSocket instead of separate HTTP calls, cutting latency and connection overhead.
26.7.24Patch

Orderflow mode, plan-aware template loading and refreshed default layouts

The chart mode formerly called Clusters is renamed Orderflow, templates explain which data plan they need before loading, and the default workspaces open on a NIFTY chart, option chain and Nifty 50 watchlist.

Improved

  • Chart mode selector now offers Orderflow (previously Clusters) and TPO.
  • Plan-aware upgrade prompt. Free and trial users opening a workspace template see a comparison of end-of-day only, end-of-day with order flow, and real-time with order flow, and can continue with end-of-day data or compare plans. NSE, BSE and MCX exchange logos are shown.
  • Default workspace layouts refreshed: a NIFTY-I 5-minute chart, a NIFTY Option Chain, a Nifty 50 watchlist and NIFTY, BANKNIFTY and SENSEX in the ticker.
  • Derivatives Positioning price range colours the intraday move from open to last price instead of from the previous close.
  • Gamma Blast is quieter by default. The greeks table, flip line, gamma zone, blast markers and strategy filters start off, three days of data load with gentler pacing, and auto-refresh is off.

Fixed

  • Workspace saves no longer upload option-chain caches. Gamma Blast and Option Strikes Profile exclude multi-megabyte runtime caches from the saved layout.
  • Default layouts load reliably, bypassing stale offline-cache responses.
26.7.20Major release

H/L Scanner, Market Pulse, Derivatives Positioning, a strategy backtester and the full TPO settings

Rolled out between 18 and 20 July. Three new market-intelligence modules, an options strategy backtester with an Indian cost model, named watchlists, a TPO settings section with every profile option, and a workspace that saves predictably.

New

  • H/L Scanner panel. Live session high and low markers across the market with market and segment filters, an optional sector or index filter, pause, clear and separate toggles for highs and lows. H/L Scanner guide.
  • Market Pulse panel. A dashboard of Nifty 50 futures bias with Flow breadth, Fresh H/L, OI posture and Order flow cards, OI leaders, most active, a Now tape and traded value and volume rankings, with a freshness window and a hand-off to the Power Scanner. Market Pulse guide.
  • Derivatives Positioning panel. Futures regime, futures and spot day range, expected move, PCR, max pain, OI concentration, call and put writing, change in positioning and a strike activity tape for any underlying and expiry.
  • Strategy backtester in the Historical Option Chain. A deterministic bar-close engine with legs chosen by ATM offset or nearest premium, entry and square-off times, per-leg stop and target, combined mark-to-market stop and target, trailing lock, re-entries, slippage and a full Indian cost model (brokerage, STT, exchange charges, SEBI fee, GST and stamp duty). Load a day's legs straight into the replay timeline.
  • Watchlist management. Create, rename and delete named watchlists, switch between them, type in the filter box and press Enter to add a symbol, sort live and pin rows. Long option symbols get a sensible width and column widths persist. Watchlist guide.
  • TPO settings section. Session start, week and month start, TPO period, count and block scale, POC and value area basis by TPO count or volume, VAH and VAL, Extend Naked POC and VA, a profile VWAP with deviation bands, and auto-fit of the price scale. Stacked TPO layouts show day separators and a TPO-native VWAP. TPO settings guide.
  • Footprint Summary: Delta % as a column with scale and decimals, plus panel position, fill opacity, row separators and a single-side or double-side bid and ask profile.
  • Browser tab shows the live symbol, last price and change of the active chart.

Improved

  • Object Manager rework. Drawings and indicators live in one render stack with groups, filtering, move up, down, top and bottom, reset to default order, show all and per-layer opacity.
  • Workspace reliability. Panel state is restored deterministically, unsaved changes are detected from a stable fingerprint, workspaces load atomically, and the toolbar shows Ready, Unsaved, Saving or Saved with a retry. Cloud autosave runs at most once a minute.
  • Historical Option Chain categorises rows by price versus OI movement (long build-up, short build-up and so on) with a legend and OI percentage columns.
  • TPO volume profile levels are native to the chart, so their POC, VAH and VAL plot distinctly from other Volume Profile indicators.

Performance

  • Alerts, Power Scanner and Debug panels load on demand, shrinking the initial workspace download.
  • Watchlist requests sparkline history only when the Spark column is visible and diffs subscriptions instead of reconnecting every symbol on edits.
26.7.17Patch

Delta and CVD from the server, and a rebuilt Multi-Strike OI time series

Candle delta, cumulative delta and the new COT high and low values come from the server's footprint data, keeping statistics consistent everywhere, and the OI time-series chart is rebuilt in-house with export.

Improved

  • Delta and CVD use server values. Candle delta, cumulative volume delta and COT high and low come from the backend footprint data where available, so candle statistics match the server, and Bar Statistics formatting is unified.
  • Multi-Strike OI time series rebuilt without the third-party charting library: tooltips, expiry selection, range selection and reset, scrolling, PNG and CSV export, with real-time updates.
26.7.13Major release

Gamma Blast, Option Chain Analyser, AVWAP Channel, greeks in the Option Chain and chart shortcuts

A single release that brings dealer gamma analysis onto the chart, option strike activity into a histogram, anchored VWAP channels from significant candles, Black-Scholes greeks in the Option Chain, undo and redo for drawings and a full set of keyboard and touch shortcuts.

New

  • Gamma Blast indicator. For index and stock options it detects the chart's underlying, loads the chain around ATM, solves implied volatility per strike and computes full Black-Scholes greeks, then aggregates dealer gamma exposure into a zero-gamma FLIP line, call and put walls and a short-gamma zone, marking blast entries with entry, stop and target labels. Settings include risk-free rate, strike count, blast score threshold and toggles for the greeks table, walls, flip line and markers. Gamma Blast guide.
  • Option Chain Analyser indicator. A separate-pane histogram of the Option Strikes Profile: strikes along the X axis with grouped CE and PE bars sized by total, buy or sell quantity, absolute delta, value or net value, for the latest candle or the candle you click.
  • AVWAP Channel indicator. Scores candles by volume, footprint delta, true range, gaps and pivot confirmation, then launches anchored VWAP curves from the important ones in three modes: Pivot Pair from the last swing high and low, Anchor Swarm as an envelope of the top anchors, and Sigma Fork from the strongest anchor with sigma bands.
  • Black-Scholes greeks in the Option Chain: delta, theta, gamma, vega, rho and IV per strike with column visibility controls, new CE and PE OI change columns in compact Indian notation, IV cells shaded relative to ATM IV, and header readouts for ATM IV, ATM straddle price, one-sigma expected move to expiry, max pain, call and put walls and the zero-gamma level. Option Chain guide.
  • Undo and redo for drawings with Ctrl or Cmd+Z and Shift+Z.
  • Keyboard shortcuts. Keys 1 to 9 switch to 1m, 5m, 15m, 30m, 1h, 4h, 1d, 1w and 1M, and a full stop opens a custom timeframe. Alt or Option with M, T, H, V, F, E or R selects Measure, Trend line, Horizontal, Vertical, Fib retracement, Fib extension or Rectangle; Shift and drag measures; Escape cancels. Shortcuts guide.
  • Touch crosshair and drawing on phones and tablets. A long press summons a sticky crosshair that a single finger repositions instead of panning, and selecting a drawing tool parks a pen crosshair at the chart centre so you can drag and tap to place points.
  • Pinned strike in Options Print. Click a strike row to pin it to a live footer readout and move the pin with the arrow keys. Ctrl or Cmd and wheel zooms row height around the cursor, the tape zooms its time axis with the wheel and pans by drag, and hovering a row shows a CE and PE card. Options Print guide.
26.7.4Patch

A calmer chart loading overlay and a Footprint Summary that sits on the chart

Switching timeframe or session shows a full-chart overlay instead of a spinner, the Profile menu links to the documentation, and the Footprint Summary draws directly over the chart background.

Improved

  • Chart loading overlay. Timeframe and session changes show a full-chart overlay with the FutPrint mark instead of a plain spinner, and transitions no longer snap mid-update.
  • Documentation link in the chart Profile menu.
  • Footprint Summary composites over the chart background; its Background Color and Opacity parameters are removed.

June 2026

26.6.25.1Major release

Options Print: a footprint of the option chain, plus a Settings sync channel and fair upgrade credit

A new Options Trading panel shows call and put activity by strike inside each time bucket, with a net-positioning tape. Chart sync gains a Settings channel, position tools size their stops from volatility, and upgrading credits the remaining value of your current plan.

New

  • Options Print panel (Add Widget, Options Trading). For every candle, a footprint of the option chain around the money: calls on one side, puts on the other, with buy quantity, sell quantity, total, delta, value, net value and trades per strike. Grid and Profile views, a 5, 15, 30 or 60-minute footprint interval, an expiry picker, previous and next candle scrubbing, Jump to latest, Ctrl or Cmd and scroll zoom, and LONG and SHORT net-value signals per strike. Live option trades stream in as they print. Options Print guide.
  • Net-positioning tape below the Options Print time slider: one column per candle with call net above the centre line and put net below, coloured by net buying or selling and tinted when a LONG or SHORT imbalance fires. Click a column to pin that candle.
  • Tick Analyser gains Volume Profile and TPO views of the same ticks, with tick and bin size and TPO bracket controls. Tick Analyser guide.
  • Chart Sync menu with a Settings channel. The toolbar Sync menu offers Crosshair, Indicators, Drawings and Settings. Crosshair syncs across every chart with it on; Indicators and Settings sync within a colour link group; Drawings sync within the group for the same symbol only.
  • Volatility-aware Long and Short Position tools. Dropping a position tool sizes the stop from recent ATR with the target at twice the stop, clamped to the screen, instead of a fixed percentage that was huge on NIFTY and useless on cheap options.
  • Fair upgrade credit. When you upgrade, the checkout shows the remaining value of your current plan as an Upgrade credit, with net, GST and total taken from the billing preview so the displayed total equals the charge. Pricing.

Improved

  • Panel toolbars scroll on narrow panels into a swipeable strip with chevrons instead of being clipped, and panel resizing follows the cursor exactly.
  • Fade Outside Value Area is rendered through an offscreen buffer so the fade is truly translucent and indicators beneath it stay visible.
  • Transactional emails carry the FutPrint header and logo.
26.6.24.2Release

Hidden Liquidity indicator and a rebuilt Option Strikes Profile with live updates

An absorption indicator built from Level 1 quote data, and the on-chart option strikes profile rewritten to load per-strike footprints and follow the latest candle live.

New

  • Hidden Liquidity indicator. Scores hidden buying and selling from Level 1 quote absorption and replenishment, with absorption and replenishment ratios, lookback, minimum absorbed volume, buyer and seller colours, component plots, thresholds and an alert bar colour. Live ticks and today's history are enriched with bid and ask size, absorbed volume and replenished size so it updates in real time.
  • Option Strikes Profile rebuilt (Option Net Value Profile). The indicator loads per-strike footprints for the chart's timeframe and, when you click a candle, shows a right-side per-strike grid or mirrored profile bars for that candle. Choose Grid or Profile, the metric (total, buy or sell quantity, absolute delta, value, net value or trades), strike count or range, ATM highlighting, panel width and load pacing.
  • Option Strikes Profile updates live. It subscribes to live option trades, refreshes today's forming candles every 30 seconds and can follow the latest candle. Default layouts now use extended trading hours.
26.6.23.1Major release

Tick Analyser, Volume Underlay, Bar Statistics heatmap and alerts that snap to profile levels

Rolled out on 22 and 23 June. A panel that narrates the tape in plain language, volume bars under price, nine new Bar Statistics rows with a heatmap style, value-area fading for footprints, and Volume Profile upgrades including alerts placed exactly on POC, VAH and VAL.

New

  • Tick Analyser panel (Add Widget, Market Overview). Plain-English commentary on every print for one instrument: a headline, strength, side, tags and an explanation, with All and Strong filters, above an Aggressor Balance session summary. Tick Analyser guide.
  • Volume Underlay indicator draws volume bars under price in the main chart with up and down colours, opacity, height, bar width and an optional moving average. Bars are pixel-snapped so they tile evenly at every zoom.
  • Fade Outside Value Area for footprints, with an Outside Opacity setting that dims cluster cells outside the value area.
  • Bar Statistics rows and heatmap. New rows for Buy %, price change and change %, bar range, relative volume with a period, average trade size, session volume, delta divergence and OI build-up (long build-up, short build-up, short covering, long unwinding). Cells can render as bars or a heatmap normalised per day or per visible range, with auto-contrast text, last-bar highlight, row separators and session totals in the legend. Bar Statistics guide.
  • Alerts snap to Volume Profile levels. Right-click near a profile to add an alert at the exact POC, VAH or VAL under the cursor, or at the raw cursor price.
  • Volume Profile upgrades: a bid × ask split mode that is stacked or mirrored, optional Auction Market Theory badges and Initial Balance per anchored group, price labels that honour the instrument's tick size, and only the forming candle re-binned on each tick.
  • Open scanner symbols in linked panels. Clicking a Power Scanner row loads the symbol into the panels linked to the scanner, or a new chart if none is linked.

Improved

  • Fixed Range Volume Profile matches the footprint. Bins use the same price-based bin height and edge rule as cluster cells so totals line up, the value area is a contiguous band expanding from the POC, and labels respect the show-as-lots setting.
  • Indicator panes can be dragged to reorder, and each pane's price axis formats values to suit the indicator.
  • Footprint Summary rewritten with a value-area band, column cells, POC highlight and headers in the same heatmap and auto-contrast language as VWAP and Bar Statistics; the live candle refreshes on every tick.
  • VWAP moves to a monochrome blue band scheme where lines fade outward and fills are darkest at VWAP; Anchored VWAP matches.

Fixed

  • Charts focus the latest data correctly on symbol, timeframe and session changes: no stale re-bucketing on a timeframe change (the cause of mis-scaling), no one-frame snap, a width-aware fit, mode switches that render in place without refetching, and live ticks that preserve your viewport.
  • Footprint Summary no longer bloats workspace saves. Its render caches are excluded from cloud and local saves, which had failed or grown to several megabytes.

Performance

  • Hidden chart tabs park their render loop instead of waking 60 times a second.
  • Indicator calculations are cached: one computed series per indicator is shared between readings, last value, colour and rendering, where previously it was recomputed up to five times per render and on every crosshair move.
  • Workspace chrome no longer re-renders on connection status, latency or log updates, and panels restore through a deterministic queue.
26.6.21Major release

The Lite plan, per-plan feature locks and pinned header tickers

Rolled out on 20 and 21 June. A new Lite tier brings end-of-day footprints to a lower price point, locked features stay visible with an upgrade prompt instead of disappearing, and the ticker strip becomes yours to configure.

New

  • Lite plan. A new tier between Free and Pro, available from every pricing surface with a one-time checkout. Compare plans.
  • Per-plan feature locks. Orderflow and Delta indicators and footprint mode need Lite or above; TPO and custom timeframes need Pro or above; tick-based modes need Max; each plan has an indicator limit per chart. Locked items show a lock icon but stay clickable so you can see what the upgrade unlocks.
  • Locked chart modes revert gracefully. If a saved or default workspace opens a chart in a mode your plan does not include, for example after a plan expires, you see the upgrade prompt and the chart reverts to candlesticks after about ten seconds so it stays usable.
  • Pinned header tickers. Pin up to ten symbols to the top ticker strip from symbol search, remove them with a click, and click a pill to load that symbol into the active panel. Pins are saved per workspace and the strip scrolls on mobile. SENSEX, CRUDEOIL, GOLD and NATURALGAS join the presets.
  • Delta (Greek) indicator plots an option's delta, registered separately from the order-flow Delta indicator.

Fixed

  • Duplicate indicator entries caused by the two Delta indicators sharing an identifier are gone from the Indicator Selector.
  • Chart text on iPhone and iPad no longer falls back to a serif font for cluster numbers, TPO letters and indicator figures.
26.6.16Major release

Power Scanner, Renko, Point & Figure and Kagi charts, log scale and auto-fit

Rolled out on 15 and 16 June. A live order-flow scanner across Nifty 50 futures, four new chart modes, a logarithmic price scale, an auto-fitting price axis, grid and decimals settings, and drawings that belong to the symbol they were drawn on.

New

  • Power Scanner panel. A live scanner over Nifty 50 continuous futures listing order-flow and OI findings per symbol: Large Print, Sweep, Delta Surge, CVD Divergence, Absorption, RVOL Spike and OI long build-up, short build-up, short covering and long unwinding. Presets for Bullish Flow, Bearish Flow, OI Buildup and Microstructure, a side filter, symbol filter, severity levels and a guide to what each finding means. Baselines use the day's real average volume per minute. Shipped as an early release. Power Scanner guide.
  • Renko, Point & Figure, Kagi and Elder Impulse chart modes. Brick and box size by fixed value, ATR or percentage, reversal settings, brick and X/O colours, yang and yin thickness, wicks and the price source. Live ticks re-derive the series. Chart types guide.
  • Logarithmic price scale, with scale-aware coordinates and axis ticks.
  • Auto-fit Price Scale, on by default: the axis fits the visible candles, any manual zoom or pan switches to manual without a jump, and a double-click on the axis re-enables it.
  • Line and Area chart settings: colour, width and Linear, Smooth or Step style, fill colours and opacity for Area, and optional swing-pivot dots with sensitivity, colours and size.
  • Grid and price-axis settings: show grid, horizontal and vertical lines, colour, opacity and style; Price Decimals with Auto from tick size so penny stocks and indices read correctly; the axis gutter sizes to its widest label; double-click the time axis to reset to latest.

Improved

  • Time-axis labels are chosen from a step ladder by on-screen spacing, land on wall-clock boundaries and emphasise the date on intraday charts and the month on daily ones.
  • Stable TPO zoom. Stacked TPO zooms anchored to the right edge so the latest session stays pinned, and Alt or Shift with the wheel reliably zooms the price axis. Fixes the double over-pan on each zoom step.
  • Drawings belong to their symbol. Drawings are partitioned by symbol inside each chart; switching symbol shows that symbol's own drawings and never deletes the others.
  • Readable instrument names in search: NIFTY26061617850CE shows as NIFTY 16 JUN 17850 CALL, NIFTY26JUNFUT as NIFTY JUN FUT and RELIANCE-EQ as RELIANCE.
  • Footprint colours follow the theme (white text in dark, black in light), with one source of default swatches so settings, defaults and the chart never drift. The drawing toolbar gets redrawn icons.
  • Tab strip scrolls natively, so a finger drag pans the tabs on touch devices.

Fixed

  • Live buy and sell classification carries across candle boundaries so the first tick of a candle matches historical aggregation.
26.6.13Major release

Option strategy backtester with thirty prebuilt strategies, auction labels on TPO and alert sounds

Rolled out between 12 and 14 June. Build a multi-leg options basket and step it through a historical session, read each profile's open and day type at a glance, hear your alerts, and open the terminal faster.

New

  • Option strategy backtester in the Historical Option Chain panel, with a catalogue of about thirty prebuilt strategies: bullish (Buy Call, Sell Put, bull spreads, Call Ratio Back Spread, Long Calendar, Bull Condor and Butterfly, Range Forward, Long Synthetic Future), bearish (Buy Put, Sell Call, bear spreads, Put Ratio Back Spread, Bear Condor), neutral (Short Straddle, Iron Butterfly, Short Strangle, Short Iron Condor, Batman, Double Plateau, Jade Lizard and its reverse) and others. Build a basket, step through the session bar by bar watching realised and unrealised P&L, name and save baskets to your profile, or switch to Live for today. Option Strategies guide.
  • Auction Market Theory labels on TPO and Market Profile. Each session is classified by open type (Open Drive, Open Test Drive, Open Rejection Drive, Open Auction) and day type (Normal, Normal Variation, Trend, Neutral, Neutral Extreme) and drawn as a label stack with an open-price marker and drive arrow; the developing session updates live.
  • Alert sounds. Choose Default, Bell, Chime, Alert or Coin per alert, and see the notification channels as In-App, Push, Email and Webhook chips. Alerts guide.
  • Debug mode. A toggle in the Profile menu unlocks a Debug panel with live frame rate, memory and feed metrics for support conversations.

Improved

  • Alert lines on the chart get rounded Bell and Delete buttons with hover states, a price-label pill and larger touch targets.
  • Symbol search opens on the first tab with results (indices, then futures, equities and options) and never hides index or equity symbols as expired.
  • Advanced chart modes such as TPO and tick-based charts are gated by plan rather than by exclusion.

Fixed

  • Chart right-click menu appears at the cursor inside every container instead of offset.
  • Time & Sales stops matching bars to stale rows; trade identifiers are now unique.

Performance

  • Faster first load. Routes load on demand and vendor code is split into cached chunks; the large NSE symbol lists moved out of the bundle and load when needed.
26.6.11Major release

A new TPO engine with a volume profile beside every column, and a terminal-wide performance pass

Rolled out between 9 and 11 June. Stacked Market Profile gets its own horizontal scale and an info box per profile, the Option Chain drops from two hundred live connections to one, and crosshair movement no longer repaints the whole chart.

New

  • New TPO engine. Stacked TPO mode has a native horizontal scale: panning is a one-to-one pixel offset, zoom scales column widths, and the crosshair and time axis read the real column layout, which ends the pan, zoom and crosshair drift. Hover a profile for a TPO Profile Info Box with session date, POC, VAH and VAL, session high, low and range and TPO count. TPO settings guide.
  • Volume profile beside each TPO column. A volume-at-price histogram with its own settings: position, metric (volume, delta or bid × ask), Histogram, Linear or Step style, width, opacity, bin size, gradient, POC, VAH and VAL lines with style and colour, HVN and LVN with counts and colours, naked POC only, inside and outside value-area colours and label format. Extended lines carry their start-date label.

Improved

  • Mobile tab strip. Panel tabs scroll horizontally on phones and a scroll drag no longer activates the tab under your finger.
  • Touch controls in settings and the colour picker respond properly, and ghost clicks after a tap are swallowed.
  • Drawing settings start collapsed so a selected drawing does not cover the chart.

Fixed

  • Blank chart after restoring a workspace. Charts in hidden tabs are kept mounted with a safe minimum size, so restoring a workspace no longer leaves an empty chart.
  • Duplicate layers in the Layer Manager: one layer per indicator or drawing, and the race that created two is closed.

Performance

  • Crosshair movement no longer re-renders the whole chart. Pointer state lives in a small interaction store with tiny overlay components for the OHLC readout and replay selection.
  • Drawings render on their own canvas between the base and interaction layers, so dragging or selecting a drawing never repaints the footprint or TPO beneath it.
  • Option Chain: two hundred connections become one. Per-symbol subscriptions are replaced by a single feed and rows re-render only when their own tick arrives.
  • Workspaces restore in parallel, idle panels skip drawing, the footer clock no longer re-renders the workspace every second and change detection pauses while the tab is in the background.
26.6.7Major release

Tick-by-tick replay, install as an app, Fixed Range Volume Profile settings and a smoother Option Chain

Rolled out between 2 and 7 June. Replay a session print by print on Max, add FutPrint to your home screen or desktop, give the Fixed Range Volume Profile its own settings, and scroll an Option Chain that no longer fights itself.

New

  • Tick-by-tick replay. Replay controls gain a Bar or Tick toggle. In Tick mode the chart replays the raw tick stream so you can watch each candle build print by print. Tick mode is on the Max plan; other plans see the option with a lock and an upgrade prompt. Replay guide.
  • Install FutPrint as an app. The web terminal can be added to the home screen on phones or installed on the desktop and launched full screen, with an offline-ready app shell.
  • Fixed Range Volume Profile settings. The drawing gets its own settings: Histogram, Linear or Step style, a bin size override, shortened labels, gradient, border and text colours, and POC and value-area line styles and widths.
  • Tick Range and Tick Number charts are enabled; the tick history parser now tolerates mixed line endings and extra open-interest columns, and ticks carry OI and previous OI.

Improved

  • Option Chain scrolls smoothly. Calls, strikes and puts live in one shared scroll container with the horizontal call and put scroll mirrored natively, replacing script-driven syncing that fought itself.
  • Watchlist saves column visibility and widths with the workspace, shows the active sort direction and keeps a finger drag on the sparkline working.
  • Indicator Selector and Chart Settings on mobile: taller touch targets, favourites always visible, a horizontal settings tab strip and a dialog sized to the screen.
  • Chart screenshots get a compact branded frame with the symbol and timeframe pill, your name and a slimmer footer.
  • Terminal chrome uses a monospace face for the ticker, Widgets button, version label and profile menu, and the plan badge reads MAX or PRO.

Fixed

  • Delta values agree everywhere. The Delta indicator and Bar Statistics compute close delta as the plain sum of per-tick deltas, the same source as the delta printed above candles, removing the fallbacks that produced mismatched numbers after a refetch. Minimum and maximum delta for the live candle recompute from streaming ticks.

April 2026

UpdateRelease

A new Heatmap, VWAP deviation bands, developing POC and value area, referrals and right-click menus everywhere

Shipped between 20 and 25 April. The Heatmap is rebuilt with sizing by volume or change and a historical date picker, Volume Profile shows how value developed through the session, VWAP gains three configurable bands, and every list panel gets a right-click menu.

New

  • Heatmap rebuilt. Tiles sized by volume or change percentage, a selectable change window and volume accumulation window, Select analysis date for a historical day or Live, Gainers, Losers and Flat filters, top and bottom lists, width-aware labels and per-tile Chart, Option Chain and Time & Sales actions. Clicking a tile sends the symbol to linked panels. Heatmap guide.
  • Add Symbols modal shared by Watchlist, Option Chain and Heatmap, searching NSE symbols by symbol, index or industry.
  • Developing POC and value area. Volume Profile gains Show Developing POC and VA with trail colours and width, Naked POCs Only, a gradient option and separate inside and outside value-area colours, and anchors the live session's right edge correctly.
  • VWAP deviation bands. Band 1, 2 and 3 multipliers, per-band line styles, fills with inner, middle and outer colours, source, anchor period or custom anchor time and lookback. VWAP guide.
  • Chart auto-fit on change. The chart performs a full fit, the same as the 0 key, once when the symbol, timeframe or mode changes and then leaves your pan and zoom alone.
  • Referral system. Sign-up accepts a referral code, also picked up from a ref link and remembered until sign-in, and a Referrals section on the profile page shows your code to copy and the code you joined with.
  • Right-click menus in Watchlist and Option Chain: Open Chart, Open Option Chain, Open Time & Sales and add or remove from a watchlist.
  • Scrollable panel tabs with left and right buttons when a group has more tabs than fit.
  • Time & Sales gets symbol search in its toolbar, Buy Vol, Sell Vol and Trades badges, and scroll anchoring so new prints at the top do not move what you are reading. Time & Sales guide.
  • Text labels on Trend Line and Vertical Line drawings, with font size, weight and colour.

Improved

  • Alerts and Watchlist columns size the symbol column to the longest symbol, keep header and body scroll in step, and the Alerts panel gains a column visibility menu. Chart panels restore their saved symbol, indicator and drawing order more reliably after a workspace loads.
  • Chart dialogs restyled: Bin Size, Custom Interval with a Will select preview, the Indicators, Settings and Sync buttons, the candle info box, the Replay toggle and the drawing settings toolbar.

Fixed

  • TPO charts no longer shift or collapse while scrolling through merged stacked profiles; groups are positioned by anchor rather than cumulative widths.
  • Chart background and crosshair colours are no longer overwritten by the theme when settings are restored.
  • Time & Sales no longer blanks out when the same symbol is broadcast again.
26.4.16Major release

The new terminal interface: every panel rebuilt on one design system, and your last workspace opens itself

Rolled out between 9 and 19 April. The workspace shell and all seventeen panels share one visual language, the most recently used workspace loads automatically, workspaces get their own URL, and indicator and drawing settings move to a single settings grid.

New

  • New terminal interface. The workspace and every panel (Alerts, Broker Login, Depth of Market, Heatmap, Historical Option Chain, Multi-Strike OI, Option Chain, Orders, Positions, Power Scanner, Settings, Straddle, Ticket, Time & Sales, Trading and Watchlist) are rebuilt on a shared design system with consistent toolbars, tab pills, status badges and symbol search. Platform & workflow.
  • Your last workspace opens automatically, so you skip the welcome screen. The workspace is reflected in the URL and can be opened in a new tab. The Workspace Manager gains template filters by type, level and tags, and an Add Widget picker.
  • New profile and workspace menu with New, Save, Load and Autosave, Light and Dark themes, Profile, Home and Sign out, and a connection state of Live, Idle, Connecting or Disconnected.
  • Indicator and drawing settings on one grid. The Indicator Selector, indicator settings, property grid, chart settings and the drawing settings toolbar share one theme, and every drawing, from Fibonacci and Rectangle to Positions and Fixed Range Volume Profile, exposes its settings through the same grid.

Improved

  • Profile context menu wording: Merge with Prev and Plot VAH, VAL and POC name the date or profile they act on, and unmerging a merged profile releases all of its followers together. Default templates open on NIFTY-I 15-minute charts.
  • Dialogs restyled: Plan Limit, Upgrade, Layout Manager with Save Current Indicator Template and Include in template options, close, group close and rename panel dialogs, the Keyboard Shortcuts popup and the Layer Manager.

March 2026

UpdatePatch

Bar Statistics rewritten for accuracy

Cumulative delta resets where you expect it, the forming bar recomputes tick by tick, and refetches no longer double-count delta.

Improved

  • Bar Statistics rewrite. Cumulative delta resets at the 9:15 session open or the day boundary according to the CVD Reset Period setting; historical bars use precomputed values while the forming bar recomputes delta and minimum and maximum delta tick by tick; a legend is drawn and expensive grid rendering is skipped at very low zoom. Bar Statistics guide.

Fixed

  • Delta and close values no longer double-count when footprint data is merged during a refetch, and footprint and OHLC are reconciled at chart level for statistics.
UpdateMajor release

Straddle chart, TPO merge and single-print extension, a seven-day Max trial, and a rebuilt live-data connection

Shipped between 10 and 14 March. A Formula Chart for straddles, Market Profile improvements traders asked for, a free trial of the Max plan, email verification at sign-in, and a connection layer that reconnects itself and fixes a missing live footprint.

New

  • Straddle Chart panel. Search an underlying, pick an expiry, choose call and put legs to add or subtract and create the straddle; straddle charts take part in workspace symbol and crosshair sync.
  • TPO improvements. Single-print zones anchor to the session start and extend right until a later profile trades through them, including zones from sessions scrolled off screen; merged profile groups always load in full; right-click targets the correct stacked profile; and the context menu gains Merge Prev, Unmerge One and Unmerge All with dates.
  • Multi-Strike OI panel revamp with Overview, Price, Volume, OI Change and Open Interest views, an expiry selector and Force refresh.
  • Seven-day Max trial at /free-trial: sign in with Google or email, verify your phone and activate. Start a free trial.
  • Email code at sign-in when a second factor is required, with Resend code.
  • Plan and connection status in the workspace header: the plan name, Free Tier, Plan Expired or days remaining, with a Live or Offline dot and an explanation on hover. Free and expired users can click it to upgrade or renew.
  • Active panel highlight. The focused panel shows a visible border.
  • Layer Manager delete, with confirmation, removes the indicator or drawing behind a layer.
  • Scrollable header on small screens with scroll buttons, and the main workspace menu opens as an overlay.

Improved

  • Live-data connection rebuilt. Heartbeats with timeout detection, exponential backoff with jitter, online and offline awareness and a single multi-symbol subscription for panels such as Time & Sales. Feeds reconnect on their own and multi-symbol panels no longer open one subscription per row.
  • Watchlist rows are memoised with themed sparklines, and Option Chain and Watchlist headers gain a Table Columns chooser.
  • 404 page redesigned.

Fixed

  • Missing footprint on the live candle. Payloads that stamp the active candle at its close boundary are shifted back one bucket so the live candle gets its footprint, same-candle points merge with the real-time stream, and timezone suffixes parse correctly.
  • Footprint is re-fetched on every timeframe change, fresh for the latest day and cached for older days, and Refetch Chart Data works again.
  • Indicators no longer toggle their own visibility because of a stale effect, and Multi-Strike OI refresh bypasses the cache.
26.3.8Major release

A new Option Chain, FutPrint sign-in with phone verification and a new profile page

Rolled out between 1 and 8 March. The Option Chain is rewritten around the at-the-money strike, accounts move to FutPrint's own sign-in pages with Indian phone verification, and the profile page shows exactly what your plan includes.

New

  • Option Chain rewritten. Independent call and put columns with scroll buttons, Center ATM in view and an auto-centre ATM lock, an expiry selector, clear loading states and a column set of LTP, IV, historical OI, delta, gamma, theta, vega and rho. Option Chain guide.
  • FutPrint sign-in, sign-up and password pages replace the hosted account screens. New users verify an Indian phone number with a four-digit code before using the terminal.
  • New profile page with current plan, status, duration, amount paid, auto-renew, billing details, market data access (real-time or end-of-day) and widget limits, with Renew, Resubscribe and upgrade actions and expiring or expired banners. Public profile, account settings, active sessions and notification preferences are separate tabs.
  • Override Global Bin Size per Volume Profile and Market Profile instance; otherwise they follow the chart's footprint bin size.
  • Replay mode polish. The Replay button has a label, opens with popups closed, and a full-height overlay with a hint banner guides you while choosing the start bar. Replay guide.
  • Zoom around the cursor. Wheel and pinch zoom centre on the cursor or pinch point, with larger steps and a smoother continuous pinch on mobile.

Improved

  • Defaults: new charts open on NIFTY-I at 5 minutes.
  • One Upgrade modal for free and expired plans, with copy that adapts to how long ago a plan expired or how soon it ends, and plan-limit prompts that go straight to pricing.
  • Colour pickers load immediately so swatches are never blank, and the current theme is disabled in the theme menu.
  • Mobile header collapses its controls properly on small screens.

February 2026

UpdateRelease

Plan-based widget limits and an upgrade prompt for end-of-day accounts

The widget picker now knows what each plan allows and says which plan unlocks more, and accounts without real-time data see an Upgrade button in the workspace header.

New

  • Plan-based widget limits. Free allows one chart and one watchlist; Lite two charts with everything else unlimited; Pro eight charts; Max sixteen. Reaching a limit opens a Plan Limit prompt naming your current plan and the next plan that unlocks more. Compare plans.
  • Upgrade prompt for Free, trial and expired accounts. An Upgrade button appears in the workspace header and an Upgrade modal opens automatically when live data is not included in your plan.

Improved

  • Checkout offers one-time payments; monthly auto-renew is marked as coming soon.
UpdateMajor release

Native TPO chart mode, triple-sided footprints, the Footprint Summary indicator and drawings on indicator panes

Shipped between 3 and 11 February. Market Profile becomes a chart mode of its own, footprints can show three metrics per bar, a side panel summarises the footprint for any range, and drawing tools work inside RSI, MACD and every other indicator pane.

New

  • TPO chart mode. Market Profile joins the chart-mode selector with bin size, value area percentage, POC by volume or TPO count, value area, VAH, VAL and POC display, value-area fill, Initial Balance, single prints with a background colour, poor high and low highlighting, TPO letters on blocks, open and close highlights, uniform, gradient or candle-based colouring, split profiles, extended POC lines and per-profile merge and split. TPO settings guide.
  • Triple-sided footprint clusters. Cluster Style gains a Triple-sided layout: three columns per bar, each showing buy, sell, delta, total volume, bid × ask, bid-ask delta, buy trades, sell trades or delta percentage, with a candle position setting and per-side colours. Footprint settings guide.
  • Footprint Summary indicator. Aggregates the footprint for the visible range or the past N candles into a side panel of one to three columns showing buy volume, sell volume, delta or bid and ask, as solid blocks or text, with panel width, opacity and an optional bin-size override.
  • Drawings on indicator panes. Drawing tools, selection, price-axis labels and range shading work inside sub-panes such as RSI and MACD, and the Layer Manager lists them.
  • Alert lines with on-chart controls: a price label with inline bell and delete buttons on the line itself.
  • Long-press on touch devices opens the chart context menu, and a separate long press arms crosshair dragging so you can scrub without panning.
  • Position tool labels show target with reward, entry with risk-reward and stop with risk, each as a boxed label.
  • Connection latency is measured from server timestamps on every tick and shown in the workspace status area.
  • Workspace saved confirmation toast after each save.

Improved

  • Bar Statistics heat shading scales colours to the running maximum for the current trading day, so colours reset each day and low values fade rather than vanish.
  • Drawing toolbar gains scroll buttons when it overflows, and modal headers are standardised.

Fixed

  • Stale candles from a previous selection no longer appear: chart caches clear when the symbol, timeframe or session changes and in-flight fetches cannot race each other.
  • Footprint data no longer disappears when the visible range changes.
  • Payments send the correct authentication token.

Performance

  • Footprints are not re-derived every frame. A shared cache serves the renderer and the value-area pull-back and trap signal algorithm.

January 2026

UpdateMajor release

Price alerts with an on-chart Alert Line, a new Time & Sales tape, and Option Chain and Watchlist row actions

Shipped between 21 and 31 January. Alerts arrive with a manager panel, a form with notification channels and sounds and a line you place on the chart. The tape is rebuilt for speed, and the Option Chain and Watchlist gain column choosers and one-click actions per row.

New

  • Price alerts. An Alert Manager panel lists alerts with symbol, exchange, condition, trigger price, status and time and lets you create, edit, delete, re-enable and refresh them. The alert form offers symbol search, above or below, In-App, Email, Push and Webhook channels and a choice of sounds. Alerts fire over the live connection and show an in-app notification with sound. Alerts guide.
  • Alert Line drawing tool. Click anywhere on the chart to place an alert line; dragging it updates the alert and removing it deletes the alert.
  • Time & Sales rebuilt as a virtualised tape with Time, Price, Quantity, Side and Value columns, a LIVE indicator, a header with trades, buy volume, sell volume and net delta, and a flash on new prints. Time & Sales guide.
  • Option Chain and Watchlist revamp. Calls and puts sit either side of the strike with spot and future reference rows, a column chooser and per-row Open Chart, Time & Sales and Add to Watchlist actions. The Watchlist gains a column chooser, Index, Industry and Symbol browse tabs, per-row Chart, Option Chain, Time & Sales and Remove actions, and Clear All.
  • Collapsible drawing toolbar that folds to a thin strip and expands from a chevron.
  • Checkout on the pricing page with one-time plan purchase, and an upgrade preview that shows how many extra days the remaining value of your current plan converts into, with the new end date.

Improved

  • Option Chain loads faster. It asks for available expiries first, selects the nearest valid expiry and fetches only that expiry's strikes.
  • Time-axis label spacing is unified across the main chart and panels.
UpdateRelease

Any custom interval, footprints built off the main thread, new drawing icons and a sortable Watchlist

Shipped between 9 and 11 January. Type any interval such as 7m and the chart fetches it, large footprint payloads are processed in a background worker so the chart never freezes, and the drawing toolbar and Watchlist get a refresh.

New

  • Fully custom chart intervals. The timeframe dialog accepts any interval as typed rather than snapping to a preset, and both OHLC and footprint data are fetched at that interval for the selected session. Symbols and timeframes guide.
  • Dedicated drawing icons for Horizontal Line, Vertical Line, Trend Line, Ray, Rectangle, Text, Measurement, Long and Short Position, Fixed Range Volume Profile, Anchored VWAP, Zoom Rectangle, Fibonacci Retracement and Extension and Path, with smaller, clearer selection handles.
  • Drag-and-drop reordering in the Watchlist; a manual reorder clears any active column sort.
  • Chart screenshots include the symbol and timeframe in a header frame.

Performance

  • Footprints are built off the main thread. Order-flow responses are transformed in a background worker, so the chart no longer freezes while large footprint payloads are processed, and COT high and low are split into buy and sell components for cluster statistics.

December 2025

UpdateRelease

Footprint presets and bin size modes, Market Profile day types and brick fade, and Initial Balance settings

Shipped between 8 and 17 December. Six footprint presets and three ways to set bin size, Market Profile that classifies each day and fades older bricks, exact price entry for lines, arrow-key nudging for drawings and configurable Initial Balance lines.

New

  • Footprint presets. Apply preset in Settings switches between Single-sided delta profile, Single-sided volume profile, Single-sided bid-ask profile, Bid/Ask blocks, Bid/Ask profiles and Delta vs Volume, or keep a custom layout. Footprint settings guide.
  • Bin Size Mode for footprints: Automatic from the price range, Manual in ticks, or LTP-Based Fixed, where the bin size follows the last price band.
  • Market Profile day types and brick fade. Each profile is classified and badged as a Trend Day, Double Distribution Trend Day, Normal Day, Normal Variation Day, Neutral Center Day, Neutral Extreme Day or Non-Trend Day, with setup cues from the previous day. Enable Brick Fade and Brick Fade Strength shade older TPO bricks.
  • Initial Balance settings in Market Profile: Show Initial Balance with line colour, width and Solid, Dashed or Dotted style, and the profile updates in real time as the last candle moves.
  • Bar Statistics colours per row for volume, trades, buy and sell volume, positive and negative delta, CVD and OI, plus a Show Cumulative Volume Delta switch.
  • Range OI in Multi-Strike OI Analysis. Pick a start and end strike to see total OI for the range and the range Put-Call Ratio. The option strike data modal gains expiry and strike-range selectors with a Range Avg tab that aggregates price, volume and OI.
  • Price field for Horizontal Line and Ray drawings, to type an exact level.
  • Thick candlestick style in footprint mode. Candle Style offers Slim or Thick; thick candles use the full column width and the candle position adjusts for single-sided displays.
  • Move drawings with the arrow keys, by pixel or by candle. Long and Short Position drawings keep their width while dragging, and Fibonacci and Ray tools drag without snapping to the cursor.
  • Layer visibility and order save with the workspace.

Improved

  • Crosshair no longer snaps to candles by default, and when snapping is on it snaps on the time axis only while price follows the mouse.
  • Crosshair and axis labels are redrawn with rounded corners, pixel-aligned strokes and themed backgrounds, and price-axis labels gain position and font-size options.
  • Right-click-drag zoom follows mouse movement continuously with consistent sensitivity at every zoom level on both axes.
  • Gann Levels simplify to a custom base price.
  • The workspace opens directly without waiting for a broker connection.

Fixed

  • OI change and daily change are computed from extended history, so the previous candle's OI and the first candle of the day are correct.
UpdateRelease

Delta Cluster indicator, Zoom Rectangle, Volume Profile highlight rules, Market Profile colour modes and a rebuilt Watchlist

Shipped between 29 November and 7 December. New order-flow readings on every candle, rule-based highlighting of profile levels, five Market Profile colour schemes, per-profile merge and split from the right-click menu, and a Watchlist with nineteen selectable columns.

New

  • Delta Cluster indicator marks runs of consecutive footprint blocks with strong positive or negative delta inside each candle, with minimum cluster size, delta threshold, labels with block counts, colours, opacity and border width.
  • Delta indicator restyled and delta metrics. Each candle carries delta high, low and close and cumulative delta; the Delta indicator draws delta bars with wicks and gains settings for positive and negative visibility and colours, zero line, bar width and opacity.
  • COT High and COT Low: the volume traded after a candle makes a new high or new low, with toggles and colours in the candle statistics settings.
  • Volume Profile highlight conditions. Define rules on total volume, delta, buy volume or sell volume with an operator and threshold, and matching price levels are highlighted with a colour, opacity and Fill, Outline or Both style.
  • Zoom Rectangle tool (shortcut Z): drag a rectangle to zoom the chart to that area, with on-screen instructions. An Orderflow + Market Profile preset layout is added.
  • Market Profile colour modes: Duo Color for value area versus outside, UniColor Gradient, UniColor, Up and Down by POC and Gradient Spectrum, each with its own colour settings.
  • Merge and split profiles from the right-click menu. The chart context menu lists each Market Profile and Volume Profile on the chart and lets you merge or split them individually. Bid-Ask Delta Volume joins the volume types.
  • Gann Levels trading zones: Call Buy and Put Buy bands behind the levels, updated as price crosses them, with configurable opacity.
  • Alt and wheel zooms the price axis vertically.
  • Hide and show panel headers across the workspace for a cleaner layout.
  • Watchlist rebuilt with a column picker for Symbol, Exchange, Spark, TS Trend, LTP, Last Size, Change, Change %, Bid, Ask, Spread, Prev Close, Open, High, Low, Volume, OI, Bid Size and Ask Size, a Reset Columns action, better search and faster live updates. Watchlist guide.
  • Multi-Strike OI Analysis shared timeline. One time-range slider drives every analysis tab.
  • Categorised Add Panel menu: Charting & Analysis, Options Trading, Market Overview and Market Data, with tooltips. Close, rename and theme-change confirmations are new dialogs.
  • Connection latency in the footer. Connection status moves to the footer with an activity icon and a live latency reading measured against a frequently updated index symbol.

Improved

  • Market Profile Initial Balance spans the first two TPO periods rather than a fixed first hour, with IB lines labelled relative to the open; Poor High and Poor Low detection considers multiple columns and a tail-length threshold.
  • Timeframe changes keep live data. Live candles and volume are re-aggregated into the new timeframe instead of waiting for a refetch.
  • Symbol search opens with the current symbol pre-filled from the chart and blank from the keyboard shortcut, with better grouping and sorting.
  • Smoother wheel zoom with cursor-anchored zoom and pan, and the Bar Statistics trades row no longer divides trade counts by lot size.
  • Volume formatting and lot size apply consistently across CVD, Delta, Stepped Volume Profile and Volume Profile. Volume Profile is on by default.
  • Autosave runs every minute instead of every thirty seconds.

Fixed

  • Indicators no longer vanish on transient resets. The workspace remembers the last non-empty indicator set per chart and restores it for inactive panels.

Performance

  • Live data is shared across charts through one symbol data store, initial fetches are deduplicated, and charts skip refetching when a tab becomes active with unchanged data.

November 2025

1.7.0Major release

FutPrint 1.7.0: cumulative delta, candle statistics, Anchored VWAP, named workspaces and Option Chain playback

The last semantic-versioned release before calendar versions, with more than fifty commits since 1.6.8. Order-flow statistics on every candle, an Anchored VWAP drawing with deviation bands, a Fixed Range Volume Profile you can drag, buy and sell POC styling, multi-axis zoom, a Workspace Manager and historical option chain playback.

New

  • Cumulative delta in Bar Statistics with session, daily or weekly reset, and candle statistics on the chart: volume, delta and CVD printed above or below each candle with position, weight, colours and spacing settings. Bar Statistics guide.
  • Anchored VWAP drawing tool (shortcut V). Click an anchor bar to plot VWAP from that point with optional one-, two- and three-sigma bands, line styles and fills. The VWAP indicator also gains a custom anchor time and lookback.
  • Fixed Range Volume Profile with handles. Start and end lines with labels, draggable handles to resize the range, and the whole profile can be moved.
  • Buy and sell POC styling. Separate background, text and border colour, style and width for buy and sell points of control, with an encompassing border in single and double footprint displays.
  • Multi-axis zoom. Right-click and drag to zoom into a box, or hold a modifier to zoom price and time together.
  • Named workspaces and a Workspace Manager. New Workspace asks for a name, a Workspace Manager modal loads and saves workspaces, and the Profile menu gathers the theme selector, load, save, new and the autosave toggle in one place.
  • Chart link settings per panel. Crosshair, indicator and drawing link states are saved per panel and survive theme changes and cloud saves.
  • Historical Option Chain playback with play and pause at 1, 3 or 5-second steps, previous and next weekday, and days-to-expiry from any date.
  • Expired contracts. The chart loads historical data for expired futures and options, and symbol search hides contracts whose expiry has passed.
  • Market Profile: single prints, LVN and HVN, custom week and month start. Price levels with a single TPO are shaded and track whether price has since revisited them; settings for the number of low and high volume nodes, extended lines, colours and labels; weekly and monthly profiles anchor on a chosen start.
  • Bin Size dialog with an automatic mode and presets, gradient volume bars, a real-time clock and connection status in the workspace bar, and tick range and tick count chart modes saved with the workspace.
  • Drawing Settings toolbar quick controls for stroke colour, line width, line style, fill, profit and loss colours, and a customisable Measurement tool.
  • Subscription expiry notice that warns before and after a plan ends, with a Request Extension button that opens a pre-filled email.

Improved

  • Imbalance detection works for directional and non-directional volume types.
  • Market Profile width is set as a percentage of candle width.
  • Indicator readouts are hidden where they are not meaningful, such as Bar Statistics.

Fixed

  • Workspace restoration no longer wipes drawings on a symbol change, and pending indicators and drawings are applied after restore.
  • Contact address updated across the app and site.
About releases

Questions about
updates and versions.

Explore the documentation

Most weeks during the trading year. Larger releases bundle new modules or indicator engines; patches follow within days when a release needs tuning. Every build that reaches users is listed here with its date, and versioned builds carry the version shown in the app.

Versions are calendar based: 26.10.13 is the build cut on 13 October 2026. A letter after a version in build logs (such as 26.10.07b) marks a same-day follow-up. Before June 2026 the terminal used semantic versions (v1.3 to v1.7); updates from that period are listed by date.

The web terminal updates itself: reload the browser tab and you are on the latest build. Desktop apps for macOS and Windows ship as installers; install the new release over the current one and your sign-in, workspaces and watchlists stay in place. The desktop guides in the documentation walk through it.

Release notes describe the product as a whole. Data timing, exchange coverage, module counts and real-time footprints depend on your plan, so a feature listed here may be limited or end-of-day on Free and Lite. The pricing page is the reference for what each plan includes.

Use the Discord or Telegram community linked in the footer, or email the team from the About page. Fixes that come from user reports are listed under Fixed in the release they shipped in.

Your next perspective starts here

Make the market
your workspace.

Data timing, coverage and tools vary by plan.