
 by TrueData
A chain of data.
A clearer picture.
Connect open interest, option-strike activity, estimated gamma exposure and strategy research in one workspace.
Go from a question
to a closer look.
Explore how each tool fits your workflow, and the details that matter when using it.
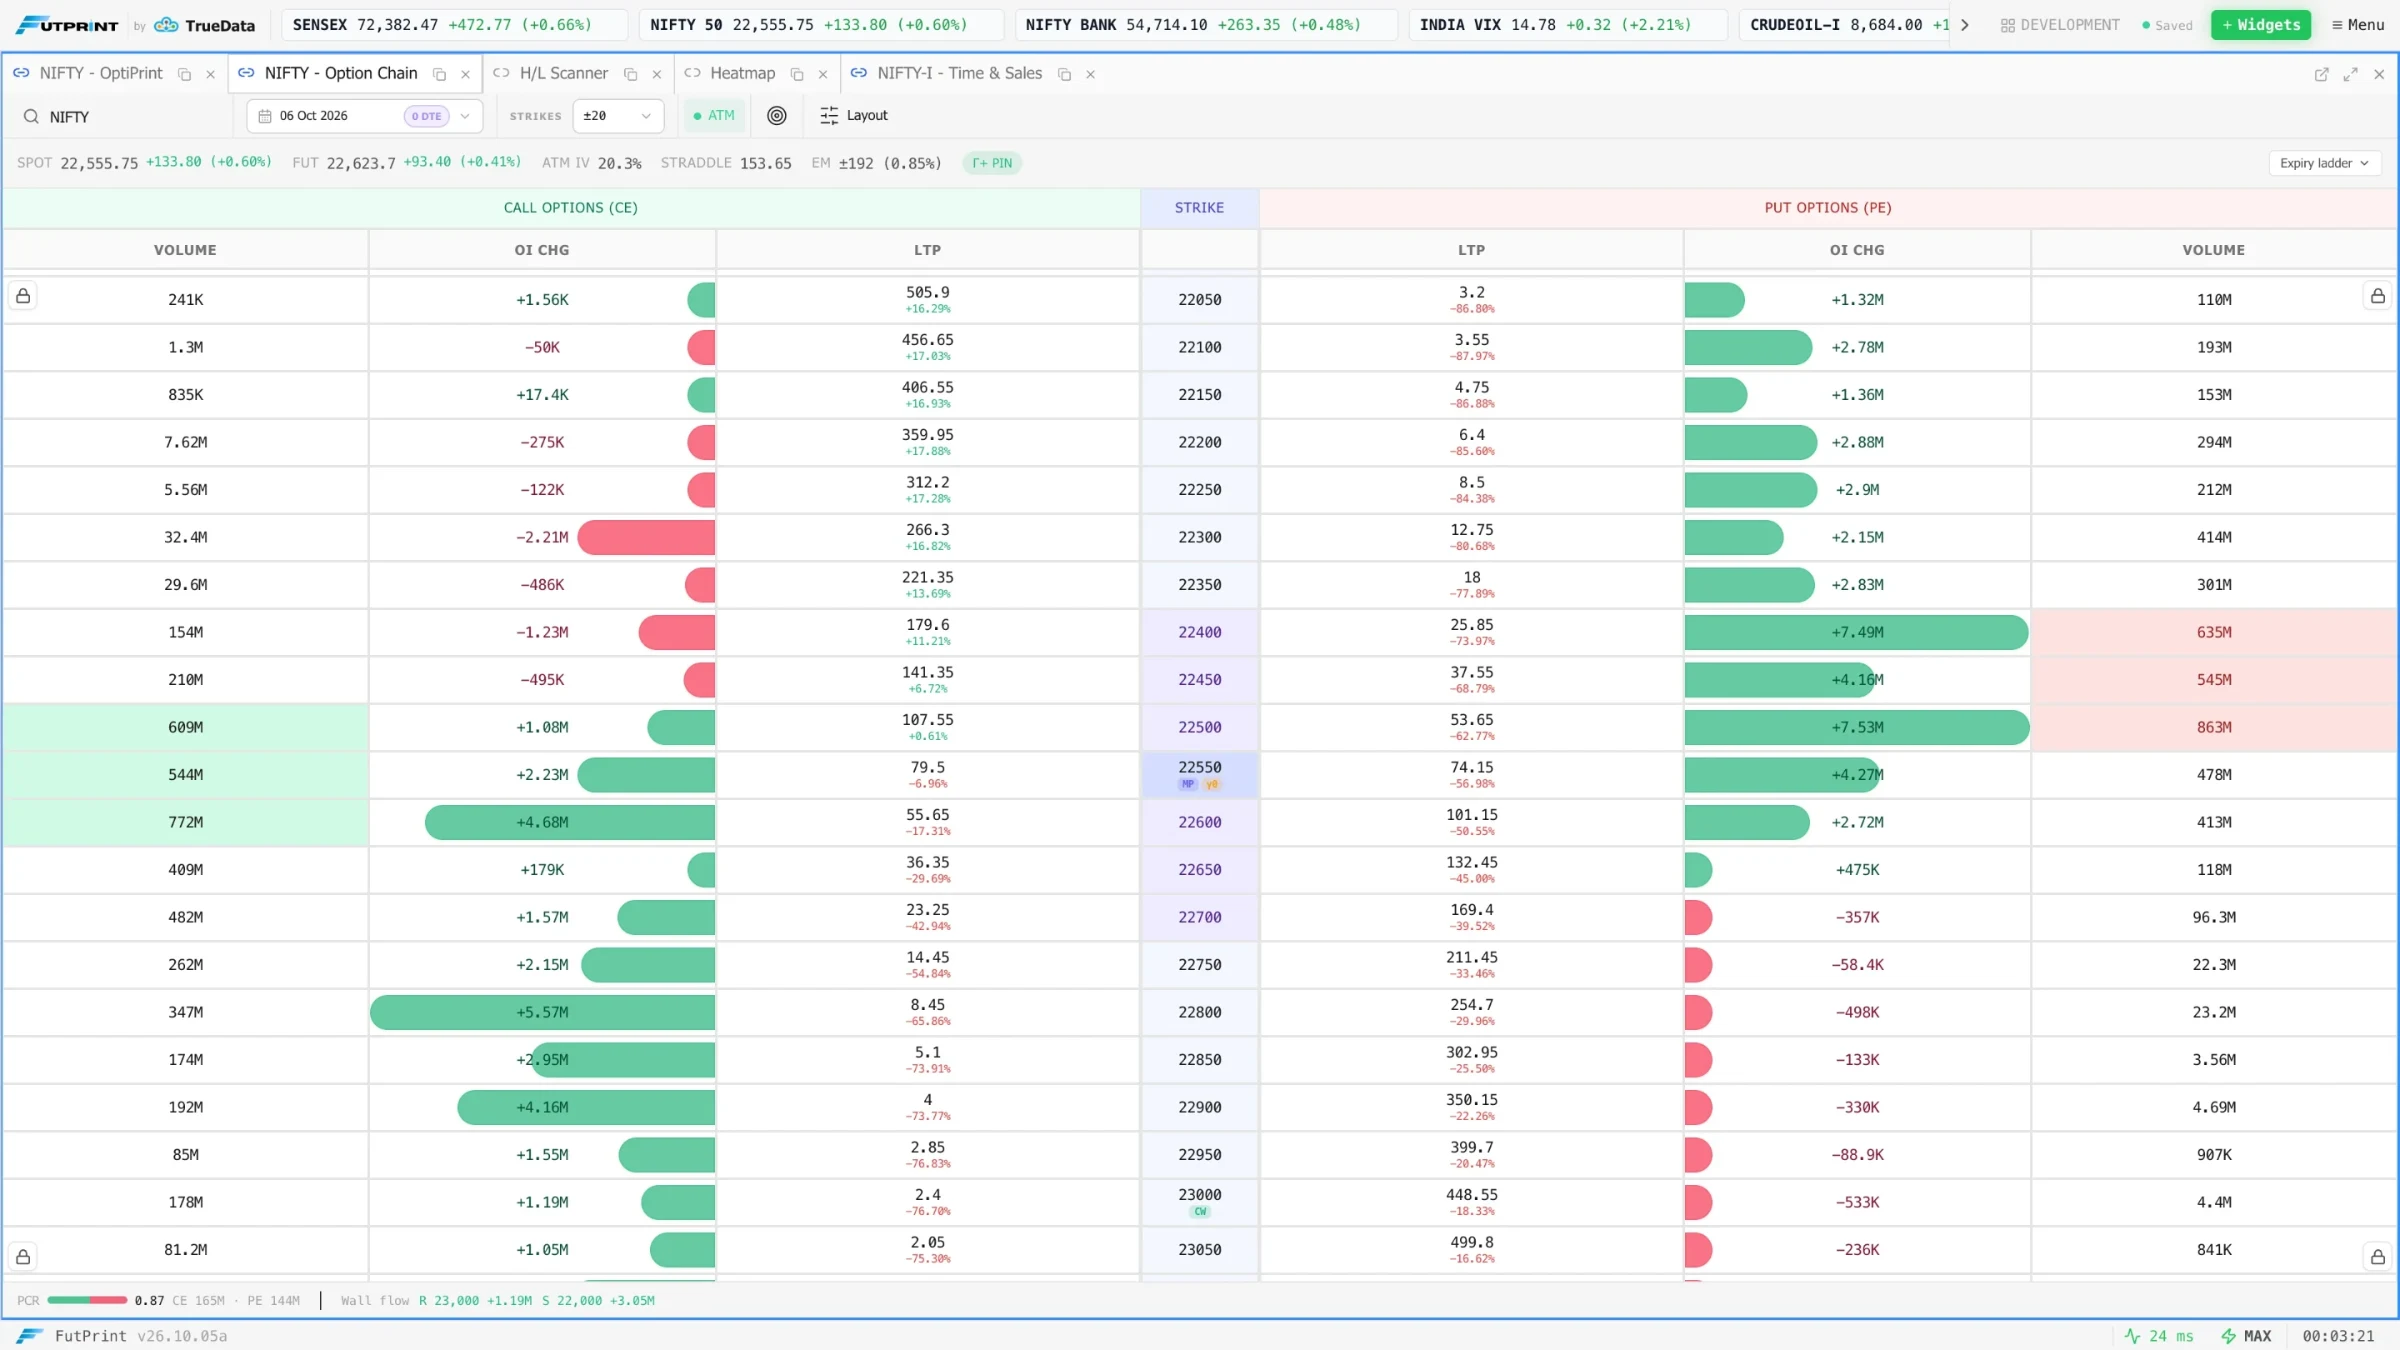
Option Chain
Select an underlying and expiry, inspect nearby strikes and open an individual contract for further analysis.
- Call and put comparison
- Expiry and strike selection
- Open-interest and option-price context
Available contracts and market fields depend on the data feed and subscription.
Read the guideOption Strategies
Choose a strategy template or build legs, set entry and exit rules, then inspect the historical results and trades.
- Strategy templates and editable legs
- Historical chain navigation and multi-day backtesting
- Exit rules, re-entry, slippage and configurable costs
The current backtest fill model uses bar closes. Historical results depend on data and assumptions; they do not reproduce tick-level live fills.
Multi-Strike OI Analysis
Select strikes and compare their OI series to investigate where positioning is changing over time.
- Multiple strike selection
- Bar and time-series views
- Underlying and expiry context
OI describes outstanding positions; by itself it does not reveal the intent or identity of participants.
Options Print
Start around ATM, select an interval and compare quantity or delta across strike rows as activity develops.
- CE/PE strike profiles around ATM
- Total, buy, sell and delta metrics
- Adjustable interval, row size and integrated tape
This is an option-strike activity view. It is distinct from a single-contract price-level footprint.
Derivatives Positioning
Review the futures regime, put–call balance and strike activity together before inspecting individual contracts.
- Futures regime and OI walls
- PCR and max-pain context
- Strike activity with window and direction filters
Regimes, walls and max pain are analytical context, not predictions of future price or guaranteed support and resistance.
Gamma Exposure
Choose an expiry, examine exposure and flip levels, then inspect the model assumptions and data coverage.
- Net, call/put and absolute exposure views
- Estimated gamma flip, walls and regime
- Configurable OI units, sign convention and model rates
Dealer positioning is estimated using a sign convention; OI does not identify dealer holdings. Previous-session fallback is labelled, and overlays require sufficient populated legs.
Read the guideExpiry Day
Pick the underlying and expiry, watch the countdown, spot against max pain and the straddle against theory, then read the strike-by-five-minute OI heatmap and hover a cell for its change, refresh count and how unusual it is for that strike. Scrub any past trading day with the time slider.
- Countdown to cutoff, spot vs max pain with the pin zone, ITM OI at risk
- ATM straddle against √time and Black-76 theory paths
- Strike x five-minute OI change heatmap with per-strike flow readouts and outlines for cells unusual for their own strike
- Replay of any past trading day, every reading at the cursor minute
Open interest reaches the terminal as a level re-sent on traded one-second rows and is carried forward where a strike printed none; readings are per minute, never per second, and the exchange publishes OI with a lag, so the last fifteen minutes of an expiry are approximate. Max pain and the straddle paths are analytical context, not a prediction of where the index will settle.
Read the guideIV Smile
Pick an underlying and expiry, read each strike's implied vol against the fitted smile, and compare the skew between puts and calls.
- Per-strike implied vol solved from live marks
- Fitted smile with rich and cheap strikes marked
- Put and call skew
Implied vol is solved from the chain's marks and repaired from neighbouring strikes when a quote is stale; it is a model reading, not a quoted figure.
Read the guideSpread Scanner
Choose the structure and width, scan the grid of debits and credits across strikes, and open a candidate in Option Strategies.
- Butterfly, iron fly and ratio spread grids
- Priced from the live chain
- Hand-off to Option Strategies
Prices are built from the chain's current marks and do not include brokerage, slippage or margin.
Read the guideFutures Term
Pick an underlying, read the phase and one-line read at the top, check roll cost, premium over spot and moved share against their usual ranges, then price the roll on the ticket and compare it with the same session in past expiries.
- Roll cost, premium over spot, moved share and expiry cards, each against its usual range
- Expiry ladder with premium, gross annualised carry, OI share against yesterday and volume share
- Roll ticket with STT on the sold leg, roll cost by session from T-8, and the premium through the day around the 15:15 spot auction
Prices and OI are one-second feed rows on dated contracts while they trade; history and end-of-day views use 15-minute bars. Futures stream on Pro and Max (MCX on Max); index spot is live on Pro and stock spot on Max, elsewhere the panel shows the last close and says so. Usual ranges cover the last three expiries the exchange lists. Carry is gross over calendar days.
Read the guideMake the market
your workspace.
Data timing, coverage and tools vary by plan.