 by TrueData
Find the activity.
Follow the evidence.
Move from breadth and sector leadership to individual order-flow events, then examine the underlying instrument.
Go from a question
to a closer look.
Explore how each tool fits your workflow, and the details that matter when using it.
Watchlist
Build a focused list, monitor price changes and send a selected symbol to a linked chart.
- Symbol search and list management
- Price and session sparkline context
- Workspace symbol linking
The free plan allows one watchlist. Quotes follow the data timing and coverage of the selected plan.
Read the guideHeatmap
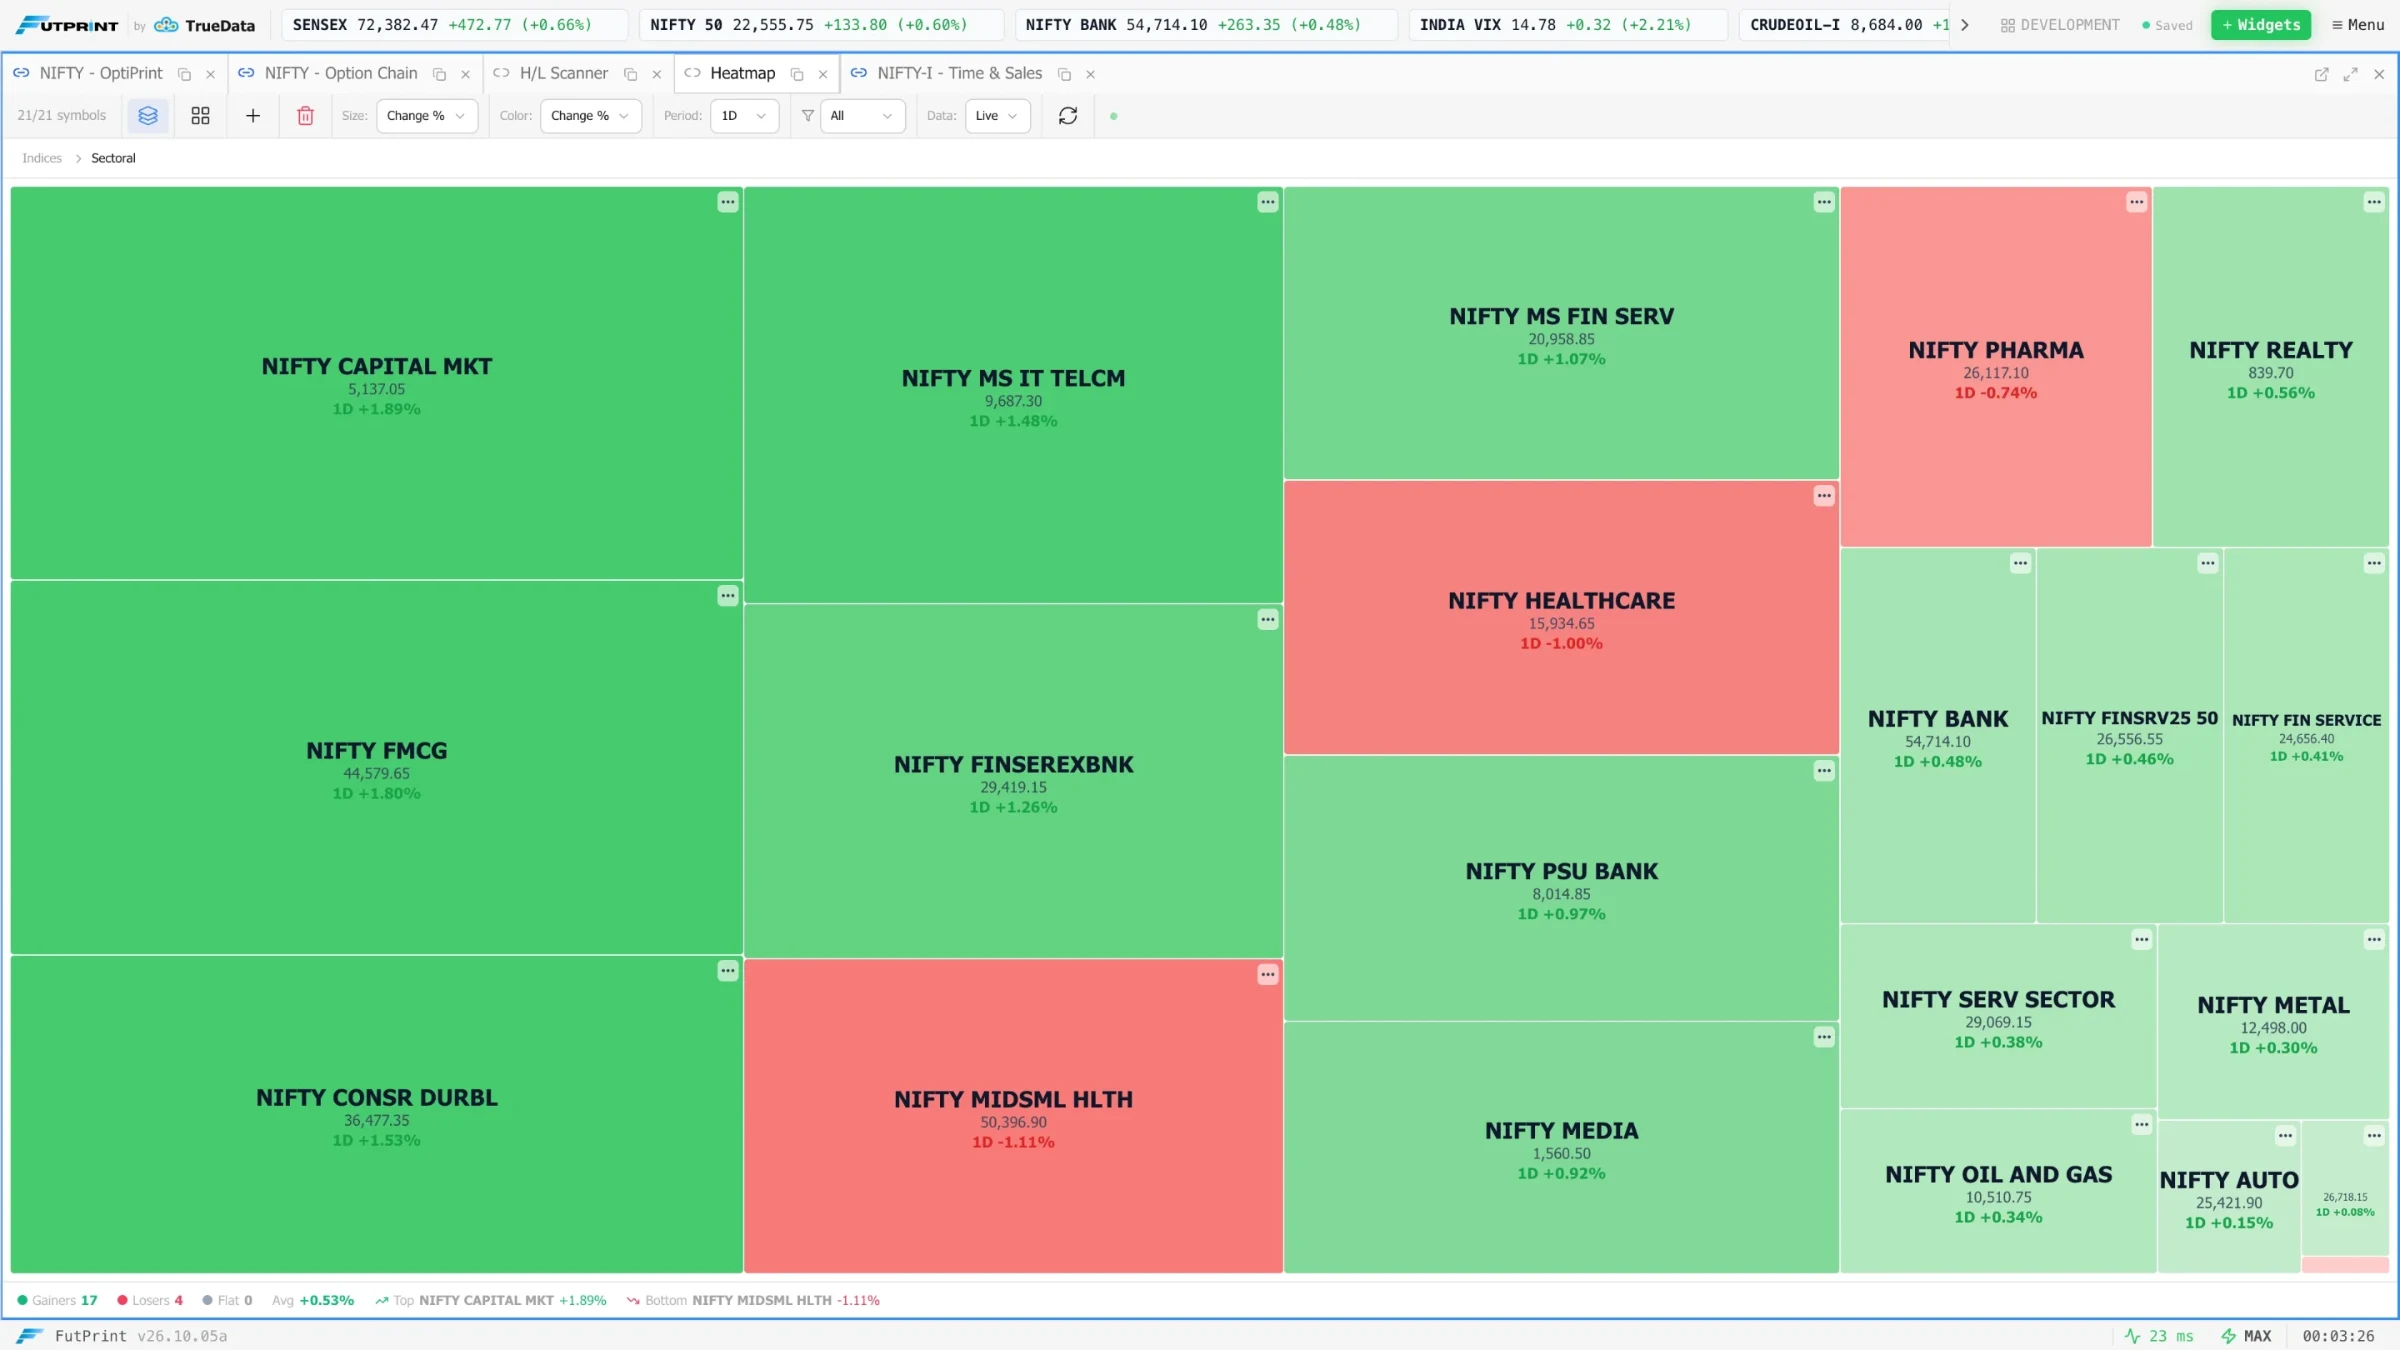
Scan the distribution of strength and weakness, then open a symbol that deserves closer attention.
- Colour-coded performance tiles
- Market-group overview
- Open instruments in the workspace
Colour represents the selected performance measure, not a buy or sell recommendation.
Read the guidePower Scanner
Choose an event preset, filter direction and severity, then inspect the numbers behind an event in its chart context.
- Large prints, sweeps and delta surges
- Absorption, relative-volume and OI events
- Severity, directional filters and in-app alerts
The current scanner universe is Nifty 50 futures. Events are rule-based observations with tunable thresholds, not guaranteed trade signals.
Tick Analyser
Select an instrument, inspect the tape and switch into volume or TPO views to put individual prints into context.
- Tick commentary, direction and strength filters
- Tape, volume profile and TPO views
- Delta, CVD, spread and large-print statistics
Commentary is derived from market rules and observed feed data; it is not evidence of an AI adviser or knowledge of trader identity.
H/L Scanner
Choose a market, segment or sector and follow fresh high/low activity as a starting point for deeper analysis.
- High and low markers
- Market, segment and sector filters
- Pause, clear and manage event rows
Supported filter labels do not guarantee feed entitlement to every exchange or segment.
Market Pulse
Start with a broad market read, select a freshness window and drill down to the symbols driving the view.
- Nifty 50 futures bias and breadth
- Sector leadership and event confluence
- Freshness windows and Power Scanner handoff
The view summarises the observed universe and window; it is not an all-market forecast.
Institutional Flow
Read the latest FII and DII net flows and streaks, scan the daily heatmap for selling depth and absorption, then switch to positioning to compare how FII, DII, client and pro accounts hold index futures and options, and to Smart Money for the bulk and block deals, insider trades and SAST filings behind them.
- Daily FII and DII buy, sell and net with streaks and window cumulative
- Participant-wise open interest by client type and instrument
- Net-position history for a chosen client type and instrument group
- Smart Money feed of bulk and block deals, insider trades and SAST filings with value and text filters
All figures are NSE end-of-day publications fetched after each session, not live data. Flow history accumulates from the day the feature launched, so early windows hold only a few sessions. Participant positioning is reported by NSE in contracts and does not reveal intent.
Market Calendar
Open the calendar before the week starts to see which days carry an index expiry, which F&O stocks report results and when RBI, the US Fed, CPI and GDP land, then filter to the kind you are planning around.
- Weekly and monthly index F&O expiries with holiday shifts
- Results board meetings of F&O stocks, grouped by day
- RBI and FOMC decisions and MoSPI CPI, GDP and IIP releases with IST times
Expiries and results come from NSE end-of-day files and its event calendar and refresh every two hours. Policy and macro dates follow the published calendars and can move; check the source before trading around a release.
Sector Rotation
Check the weekly chart at the start of the week: sectors moving from Improving into Leading are gaining strength against the Nifty, and those sliding from Weakening into Lagging are losing it. Switch to daily for a faster read.
- Relative rotation chart of 21 sector indices plus Midcap 100 and Smallcap 100
- Weekly or daily view with 4, 8 or 12-point trails
- Quadrant counts and a ranked table with 1-period and 4-period returns against the Nifty
Built from NSE end-of-day index closes, so it updates after each session. Rotation describes relative strength; it does not predict the next move.
Make the market
your workspace.
Data timing, coverage and tools vary by plan.