
 by TrueData
Every move.
More context.
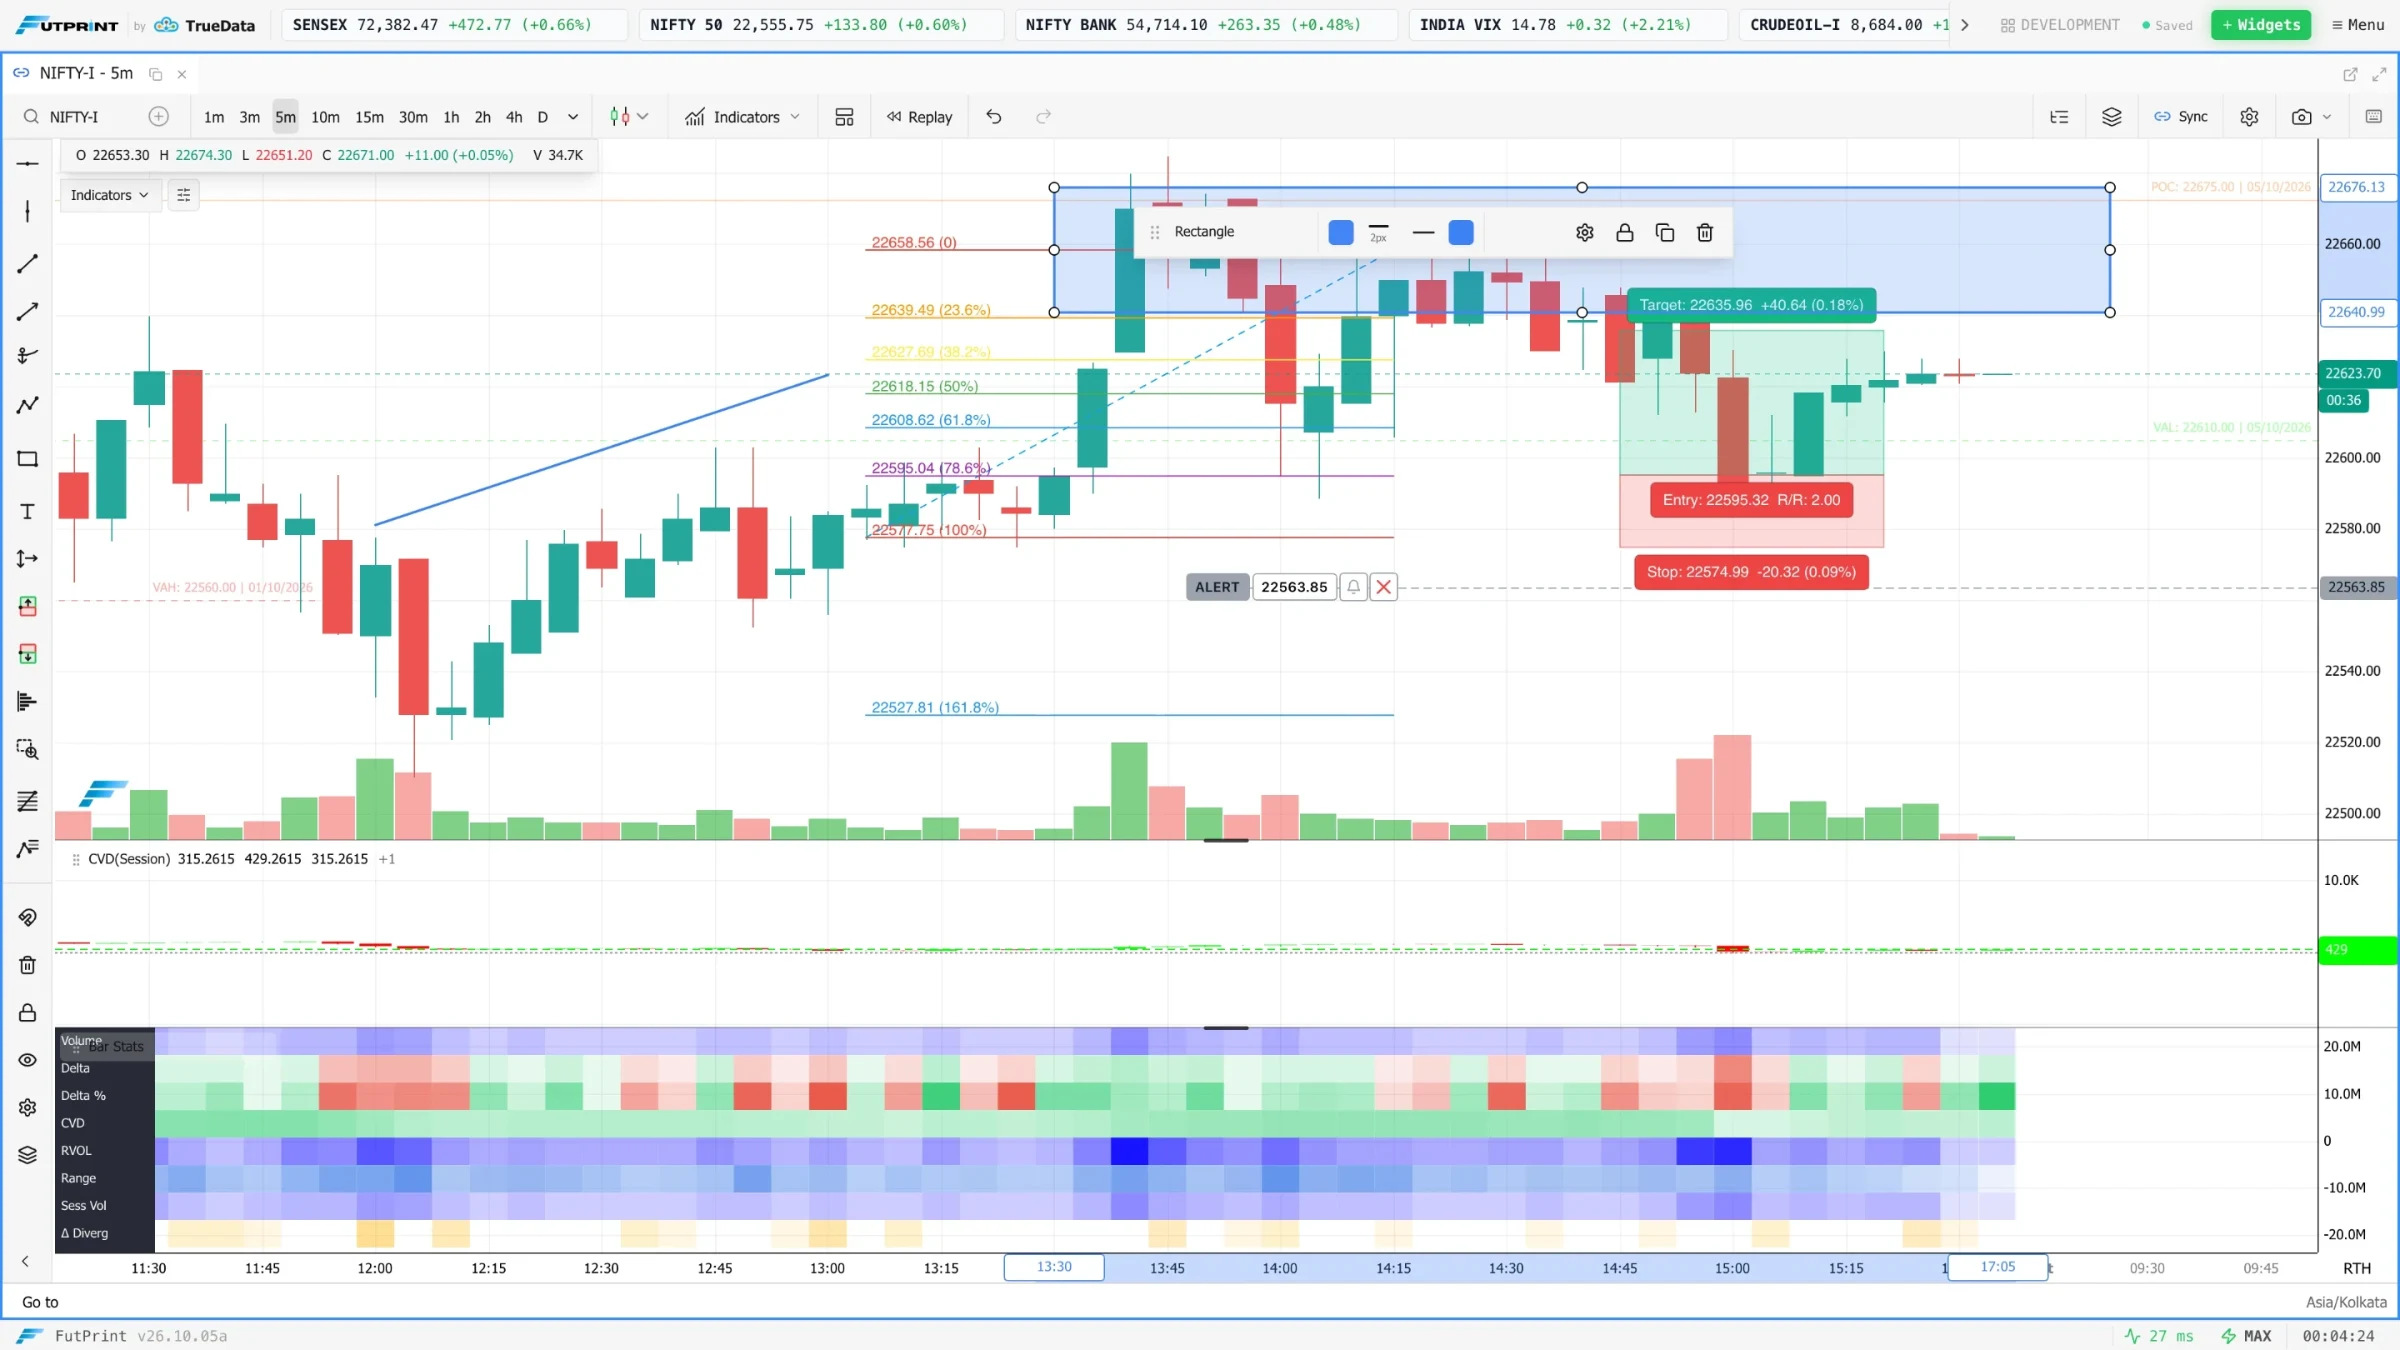
Switch from price structure to the activity inside each bar. Build a chart around the way you read the market.
Go from a question
to a closer look.
Explore how each tool fits your workflow, and the details that matter when using it.
Chart
Choose an instrument and interval, add your analysis, then link the chart to the rest of your workspace.
- Candlestick, OHLC, line and area views
- Footprint, TPO and non-time-based chart modes
- Drawing tools, indicators and saved chart settings
Chart and indicator limits depend on your plan. Data availability varies by instrument and mode.
Read the guideFormula Chart
Combine contracts to study a straddle, strangle or another weighted instrument formula alongside your main chart.
- Add or subtract instrument components
- Edit component weights
- ATM straddle tools and linked chart analysis
A formula chart visualises combined prices; it does not execute a multi-leg strategy.
Script Editor & Compose with AI
Describe the study or strategy you want, or ask for a change to the open script. The script is typed into the editor as it is generated, compiled on the spot and sent back for a fix when the compiler objects. Save it and it appears under My scripts in every chart's indicator list.
- Compose with AI: plain-language requests become complete OpenScript, revised in conversation
- Editor with diagnostics, completion, hover help and formatting
- Order-flow, open-interest and footprint series readable in scripts (flow, oi and fp)
- Strategies backtest in the Strategy Tester with estimated Indian F&O charges
Compose with AI is included in the Pro and Max plans, trials too, with 50 generations per account per day. It writes and revises scripts only and does not give trading advice; a script that compiles still has to be tested. Saved scripts count toward the chart's indicator limit.
Read the guideIndicators & drawing tools
Combine trend, momentum, volatility, volume and order-flow studies, then mark levels directly on the chart.
- Indicator library with configurable parameters
- Trend, oscillator, volatility and profile families
- Drawing tools and chart shortcuts
Indicator instance limits vary by plan. Exact library counts should be generated from the runtime registry.
Read the guideMake the market
your workspace.
Data timing, coverage and tools vary by plan.