
 by TrueData
Price moves.
See the participation.
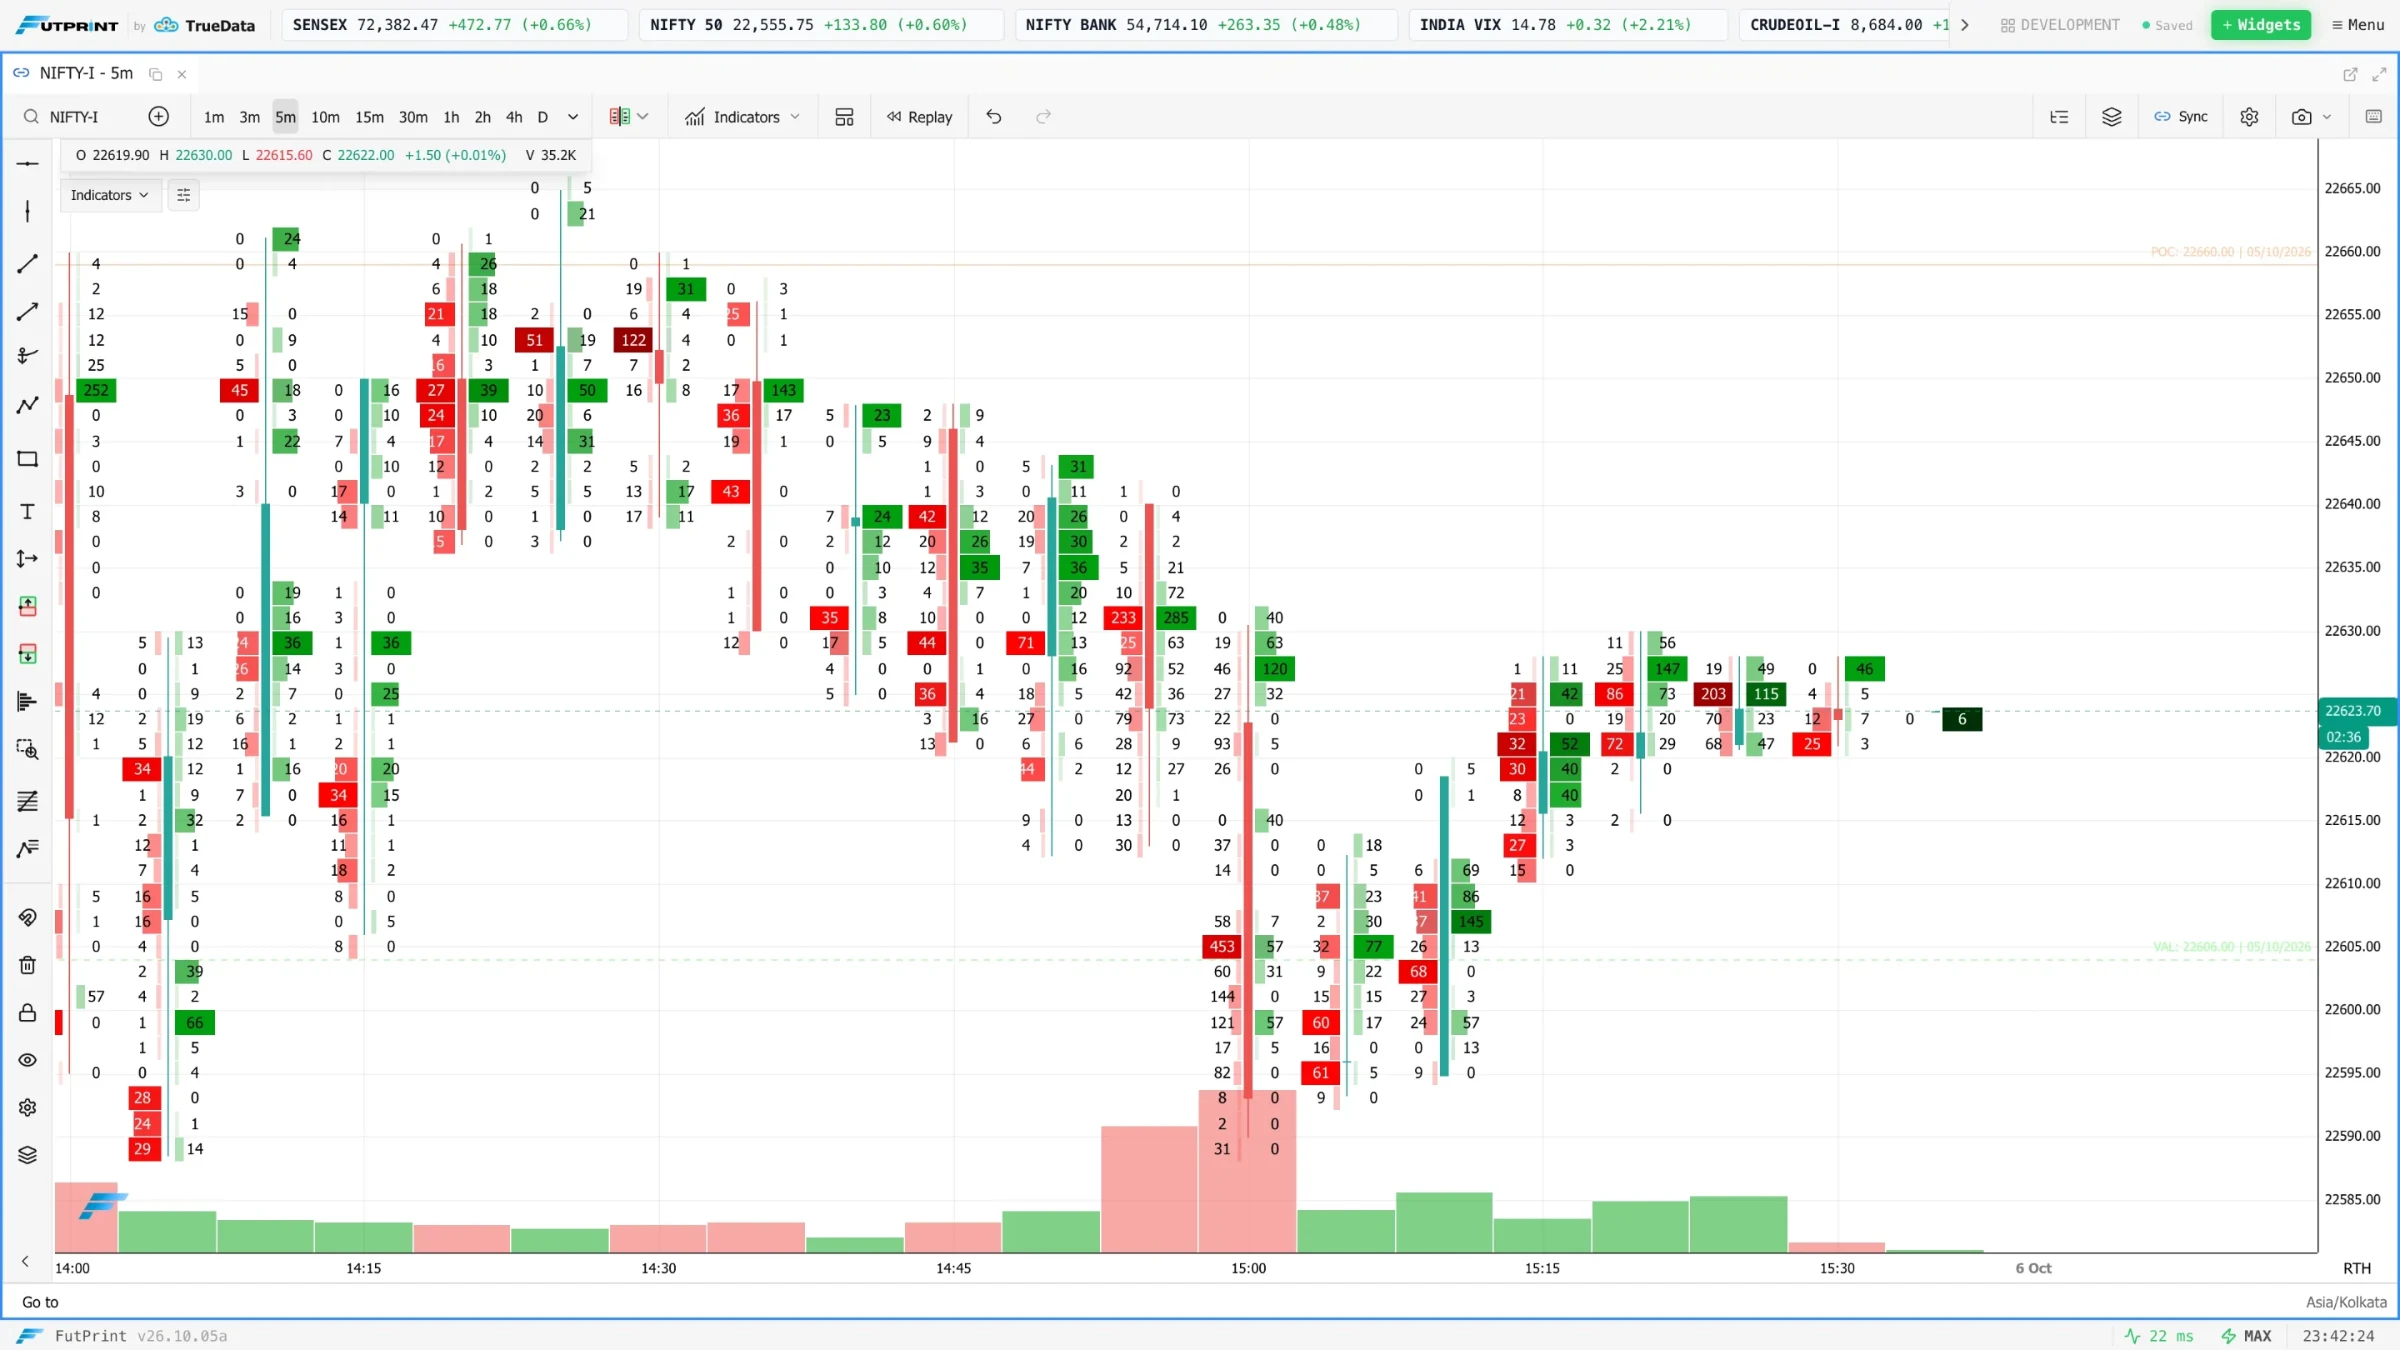
Explore footprint candles, CVD and delta, large-trade bubbles, bar statistics and the tape. See how traded activity develops inside a price move.
Go from a question
to a closer look.
Explore how each tool fits your workflow, and the details that matter when using it.
Footprint & imbalances
Compare participation within a bar, inspect highlighted imbalances and relate them to nearby price structure.
- Bid–ask and delta views
- Configurable bins and imbalance settings
- Bar statistics and footprint summaries
Aggressor classification and derived signals depend on data quality and settings; they do not identify individual participants.
Read the guideCVD & Delta Volume
Place delta and cumulative volume delta beside price to study whether directional participation strengthens or fades during a move.
- Per-bar delta and cumulative volume delta
- Configurable indicator parameters and presentation
- Separate analysis panes alongside price
Delta depends on trade-side classification. Divergence is context, not a guaranteed reversal signal.
Volume Bubbles · Big Trades
Add the Big Trades indicator to any chart type, set a minimum lot size, choose individual prints or aggregated activity, and inspect buy/sell markers around a price level.
- Works on candlestick and cluster charts alike
- Individual and aggregated detection modes
- Lot-size thresholds and side filters
- Labels that follow zoom, with the largest prints always labelled
Markers represent observed trades; they do not identify institutions or reveal resting orders.
Bar Statistics
Choose the rows relevant to your method and compare volume, delta and trade counts as the session develops.
- Volume, buy/sell volume and trade counts
- Delta, delta percentage and cumulative delta
- Optional open-interest changes where available
Available fields depend on instrument and feed coverage.
Time & Sales
Watch price and traded size in the tape alongside a footprint chart to study the activity around a level.
- Trade-by-trade price and size
- Instrument selection
- Linked workspace context
Trade-side interpretation depends on the available market data. Executed prints are different from resting order-book liquidity.
Make the market
your workspace.
Data timing, coverage and tools vary by plan.